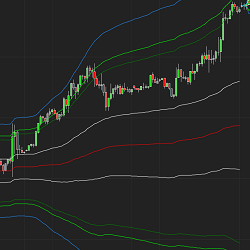
tcVwap is an indicator for monthly, weekly and daily VWAP calculation. VWAP is an indicator representing fair price of a financial instrument. This is the Volume Weighted Average Price. The VWAP mean price is often used by institutional traders as a reference.
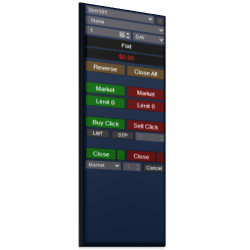
The Close Bar Entry Orders module initiates logic to submit orders immediately on the close of a bar. All orders are submitted using the account, quantity, and ATM strategy controls in the Enhanced Chart Trader. This removes unnecessary stress and challenge from entering orders when a bar closes.
Mentor one to one what you'll find inside: 8 hours of live lectures, 4 hours of live backtest, community discord lifetime live weekly backtest, weekly live review, live archive, markup price action, lifetime updates on new concepts, private structure indicator.
This is an order replication add-on between accounts. It replicates orders from a Leader Account to multiple follower accounts according to the replication method selected. There are several replication methods, each with its own functionality. It replicates orders in both NinjaTrader 7 & 8.
With decades of experience, EMS specializes in the creation of custom software for clients worldwide. For over twenty-five years, EMS has been helping our clients reach their goals with honesty, integrity and fairness. Contact us for a complementary consultation.
Learn a battle-tested strategy for trading the markets in under 60 mins per day. Here’s just a fraction of what you’ll learn: How professional traders find good trades, how to read the markets and a market that has unique advantages over others.
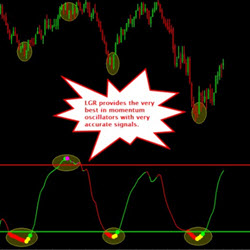
The LGR is a composite Triple Momentum Index Oscillator. LGR indicator is a proprietary design that gives the trader the crème de la crème of momentum oscillators by combining into a single indicator. No more figuring out which oscillator to choose.
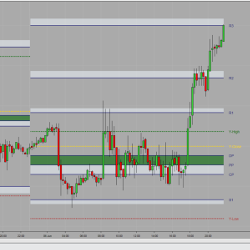
Session Pivots are a well known trading technique to calculate intraday support and resistance points. Because of its simplicity and efficiency, it is still a very reliable method for determining key support and resistance levels.
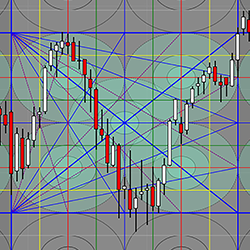
The Samri Math Diamond Grid is a drawing tool which is applied by drawing a square on a chart. The tool then automatically displays graphic elements which are based on calculations from the methodologies of Gann & Murrey.
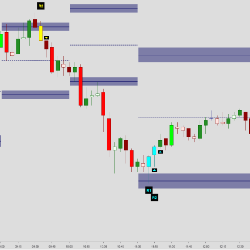
The Auction Bars indicator identifies higher time-frame ranges, displayed as Auction Ranges. These ranges show the current market value area of the ongoing auction. The accompanying congestion zones work as support / resistance where spike and reversal patterns frequently plot.
December 2, 2024
Mastering Sideways Markets With Auction Bars and Range Projections
November 19, 2024
Enhancing Your Automated Trading System: Key Insights from Best Pro Trade
November 14, 2024
NinjaTrader New Ecosystem Tools: October 2024 Edition
Enter Email for Updates