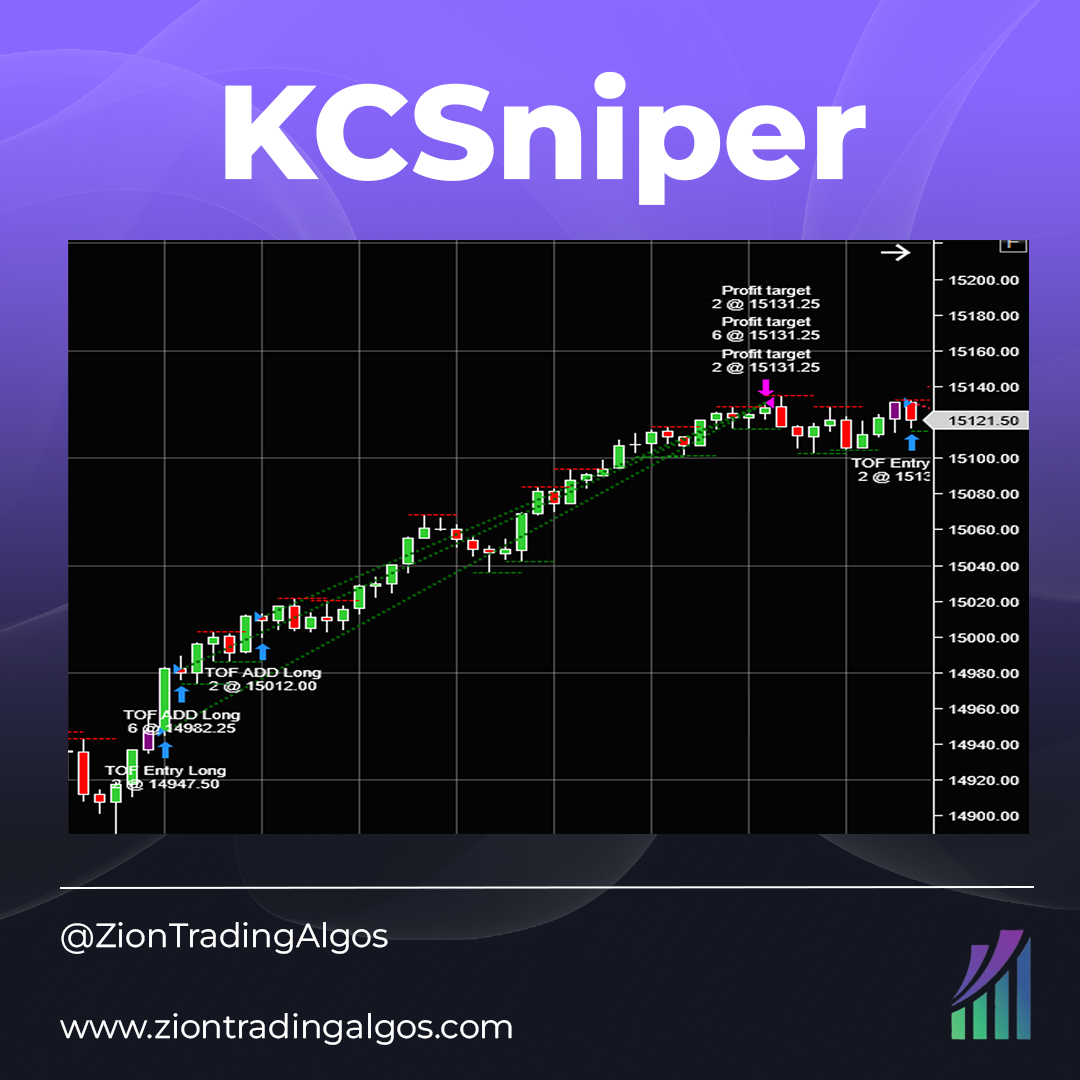
KCSniper is a Keltner Channel-based system on the 10-minute chart. It is long only and does not pyramid into positions, but has a single entry and exit model. It uses volatility based stop loss and take profit targets to remain adaptable. Trades MES and MNQ.
The Ichimoku Mentoring Program contains 4 weeks of pre-workshop webinars, a live 2-day boot camp, 2 months of post course mentoring, access to the trade room & Ichimoku research center. Learn more!
RTMC MNTrader is a fully automated trading system. Trading is based on Renko strategy using an exponential moving average. Filtering system based on the MACD and TMA Slope indicators. It has an improved position support system with flexible settings that will improve trading consistency.
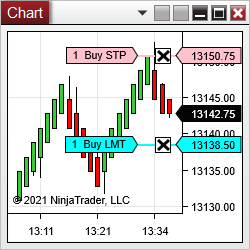
Clicker allows one to enter orders with one click directly on the chart! Modifier keys and mouse buttons for buying and selling are configurable. The order type is detected from the clicked price relative to the market price. All order parameters come from ChartTrader. Free trial for seven days.
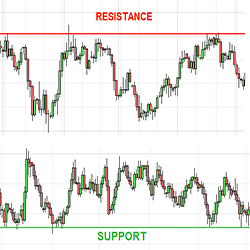
Plots chart and/or synthetic support and resistance lines from a higher time frame.
CommoditySignal is an essential trading signal app for commodity traders, offering precise signals for Crude Oil, Natural Gas, Gold, and Silver. Experience a 3-day free trial to see its effectiveness firsthand. Available on both iOS and Android, CommoditySignal delivers timely insights.
This automated futures and forex trading system improves trading results. It takes trades automatically from the press of a button, and makes money consistently. The capital requirement for trading is very low - just $500 per E-mini futures contract.
Earl's PseudoVolume Indicator displays relative volume for each bar of a tick chart, making anomalous activity spikes much easier to spot. Trade with more confidence and without wasting time checking a time-based chart whenever you get an entry signal and suspect anomalous activity.
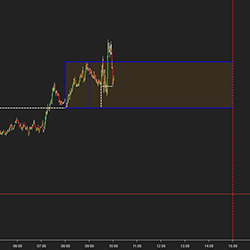
Add the visual benefit of displaying the session open value (settable). Build a visual range of any timeframe you choose. For example, the first 30 minutes of the market open or an hour before the market opens. Choose the end time for a range to stop displaying for the day.
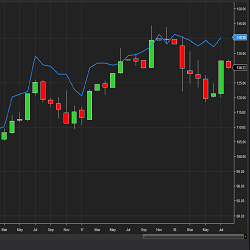
The StockCalcValuation indicator displays a fundamental valuation for the company you are examining. At StockCalc we value 8000 companies each night using 6 valuation models or data points and determine a Weighted Average Valuation from these calculations for display. Get your free trial now!
December 2, 2024
Mastering Sideways Markets With Auction Bars and Range Projections
November 19, 2024
Enhancing Your Automated Trading System: Key Insights from Best Pro Trade
November 14, 2024
NinjaTrader New Ecosystem Tools: October 2024 Edition
Enter Email for Updates