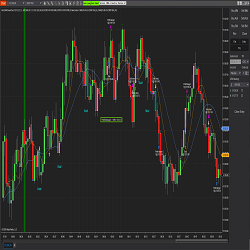
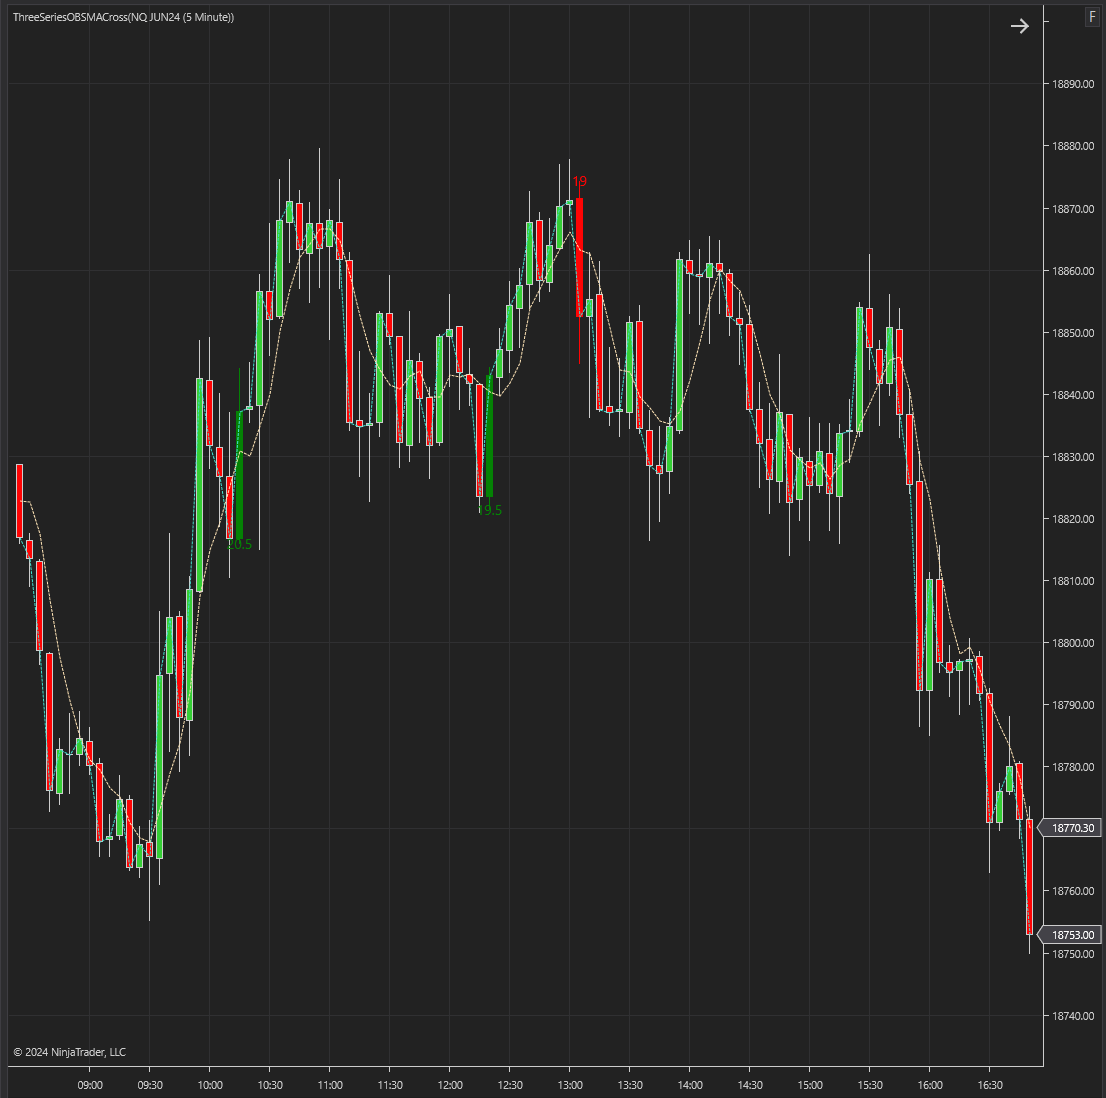
The SMA CrossOver Strategy is one of the simplest, for ease of use and understanding. This simple strategy has been amped-up to include current day price Highs and Lows, Traps, Consolidation, Long Bar and dynamic Bullish and Bearish trend algorithms for precision filtering to find the perfect entry.
Gain an understanding of trading: market analysis, technical analysis, fundamental analysis, indicator trading, day trading/scalping, strategies, trading psychology, expectation and mindset, money management and risk management. Practice on a demo account. Referring trading brokerage/platform.
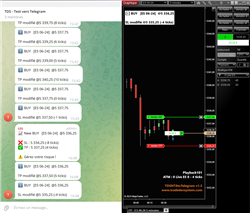
This indicator will be responsible for sending on your telegram channel your positions taken using ATM.
Rose provides one-on-one coaching for traders. She guides students on various topics: Psychology, her Fibonacci trading system, mindset, performance, risk management, etc. Rose helps traders get to the next level of their trading career. Get started with a free consultation with Rose today!
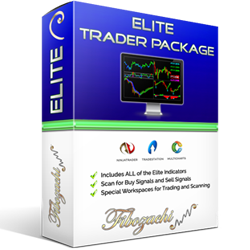
Simplify your trading process! The Elite Indicators predict major tops and bottoms, diagnose the direction and strength of price action, and calculate the best stop-loss and profit-target levels! Try a 30-day demo today!
This Indicator is a sophisticated tool designed to help traders identify and capitalize on bullish and bearish market trends. By combining Simple Moving Averages (SMA) and engulfing pattern detection, this indicator provides clear and actionable signals for entering and exiting trades.
NinjaProgramminSchool has been assisting traders for over 5 years in the creation of custom indicators and automated strategies at a reasonable cost. Do you have an idea you want coded or automated? Let us walk you through the process.
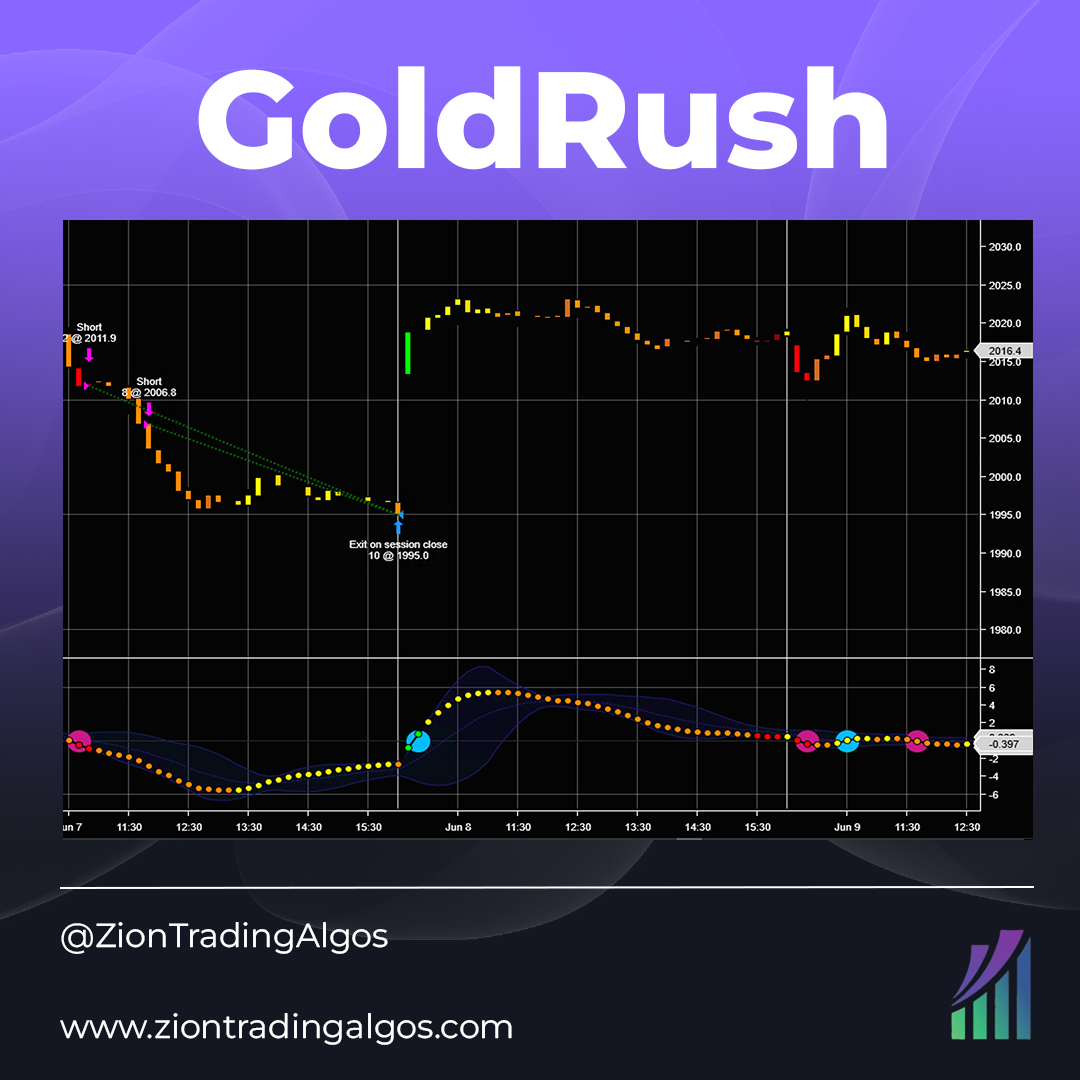
GoldRush is an intraday strategy on the 10-minute chart. Designed to take an initial amount of GC contracts, it uses a few custom indicators that will also be included with purchase.
ForexAlgo is a powerful trading signal app designed for Forex traders, offering precise signals for Forex pairs. Enjoy a 3-day free trial to experience its accuracy and effectiveness. Available on both iOS and Android, ForexAlgo empowers traders with timely insights.
The versatility of the system extends to both trend and reversal trading strategies, accommodating scalping, day trading, and swing trading. It seamlessly operates on various bar types and timeframes, offering dynamic Support/Resistance lines and intuitive market insights.
December 2, 2024
Mastering Sideways Markets With Auction Bars and Range Projections
November 19, 2024
Enhancing Your Automated Trading System: Key Insights from Best Pro Trade
November 14, 2024
NinjaTrader New Ecosystem Tools: October 2024 Edition
Enter Email for Updates