The CB Internals Panel shows you the breadth of the market long and short term. Combined with custom audio alert, it lets you know when the market is moving. It has been in development since 2016, and the current version stands alone.
Tacheon Warp is a leading time-based indicator which analyzes markets and projects predictive time-based signals on the right hand side of the chart. Buying and selling pressure signals appear in the future, alerting users to the possibility of moves that have a likelihood of occurring.
Scalper Ticket was made to facilitate and improve the performance of scalping operations by gaining speed in quantity changes at the bid/ask levels. It shows the first book line, position average price and the PnL with commissions cost. A perfect match to use in conjunction with the SuperDOM.
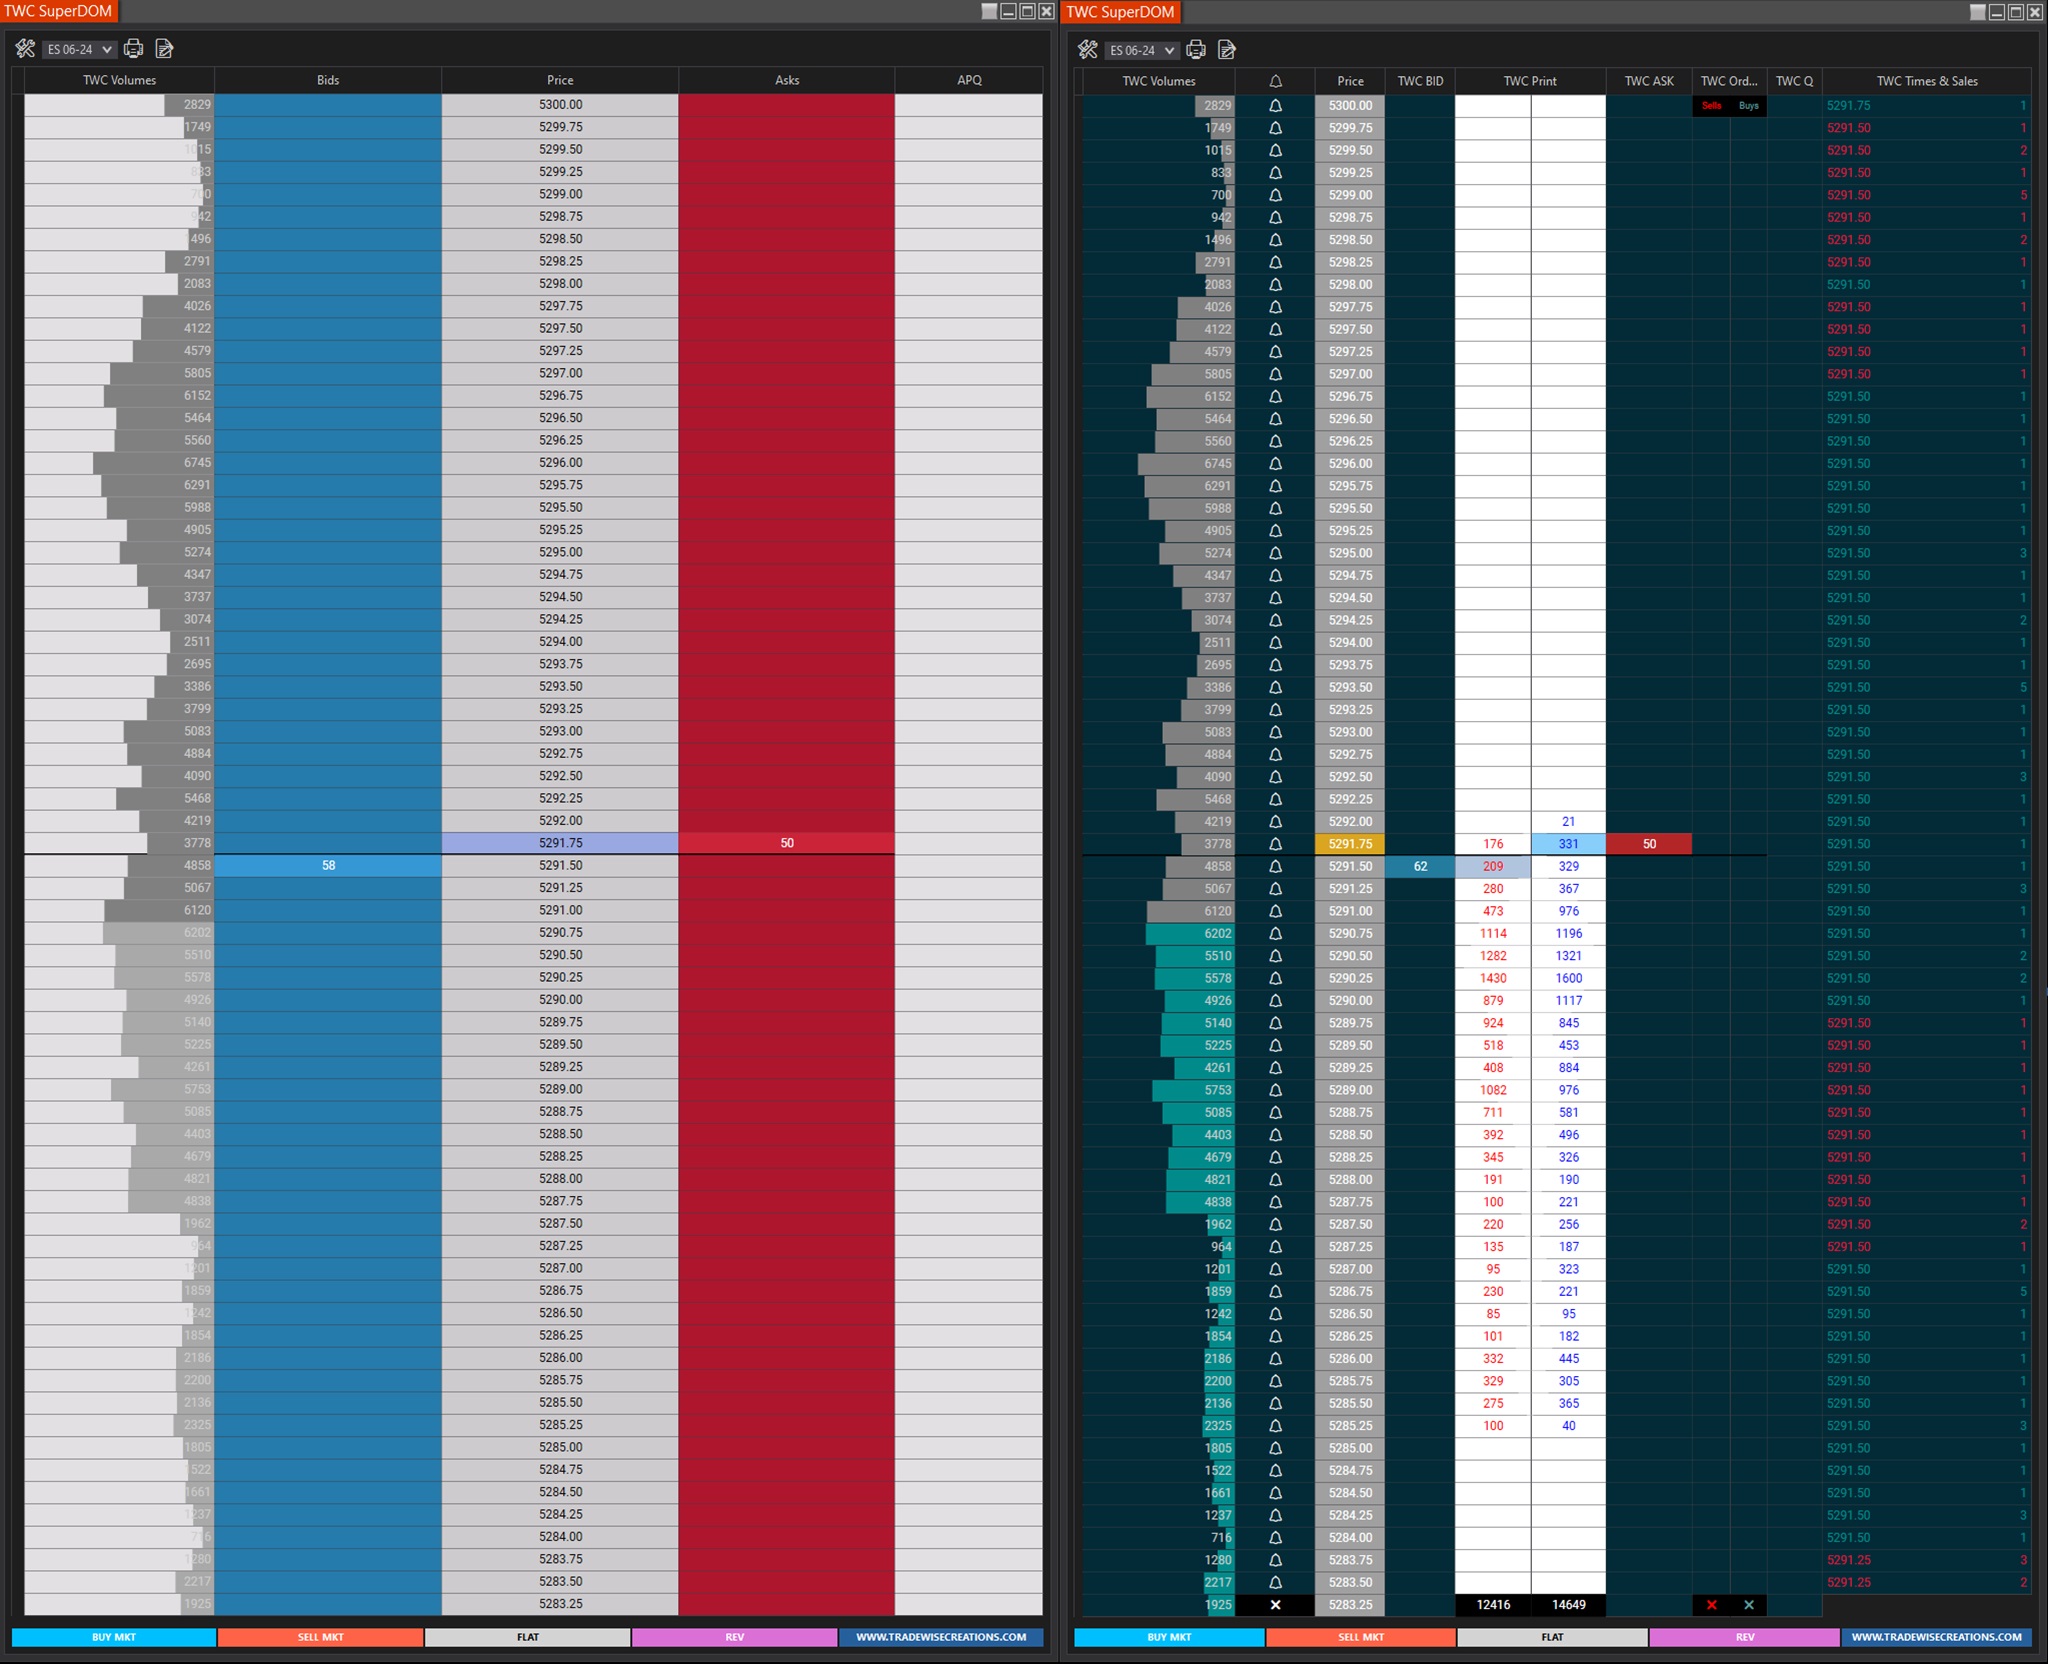
The Super Dom TWC displays a list of all buy and sell orders for a given asset, such as futures and currencies, along with corresponding prices and quantities. The team included all the essential setting and functionalities that traders need.
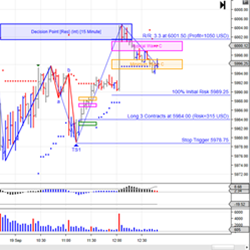
MTPredictor offers a suite of Elliott Wave, Volume, Fibonacci & position sizing add-ons that allow traders to find & asses trades in the Futures, Stocks and Forex Markets. Sign up for a 15-day trial today!
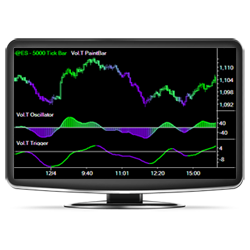
The Vol.T™ indicator package diagnoses volume-trend and tick-pressure to provide trading signals based on buying or selling pressure (rather than just movements in price). Come see how the Vol.T™ Indicators utilize volume and tick data more effectively than ever before!
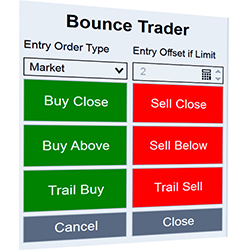
Get fast and accurate fills with Bounce Trader. Trade directly from your charts. Easily trigger orders on bar close, bar reverse or open OCO orders depending on how bar closes. Select between market or limit orders. With Bounce Trader and Simple EMA’s, it is easy to spot where price bounces from.
This free package includes Symbol Watermark, which shows the name of the symbol and time frame directly on the chart; Trader Limit, which limits trading when the daily loss level is reached; SR Dynamic Lines (dynamic resistance zones); and many other useful tools. These products are free for life.
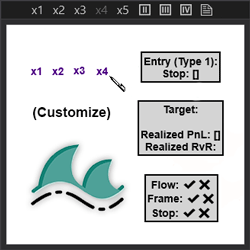
This indicator allows the user to create custom text buttons and quickly draw them on the chart, increasing application functionality and user charting efficiency.
Bold Bot is a strategy for NQ which will analyze the product for long trades.
December 2, 2024
Mastering Sideways Markets With Auction Bars and Range Projections
November 19, 2024
Enhancing Your Automated Trading System: Key Insights from Best Pro Trade
November 14, 2024
NinjaTrader New Ecosystem Tools: October 2024 Edition
Enter Email for Updates