Mentor one to one what you'll find inside: 8 hours of live lectures, 4 hours of live backtest, community discord lifetime live weekly backtest, weekly live review, live archive, markup price action, lifetime updates on new concepts, private structure indicator.
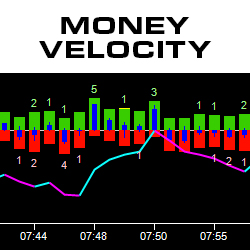
The Money Velocity indicator visually presents Time and Sales data. Easily see real-time bars featuring the number of sales at & above the ask price plus the number of sales at & below the bid price. Additionally, the indicator displays the difference, order flow trend and block trades. Learn More!
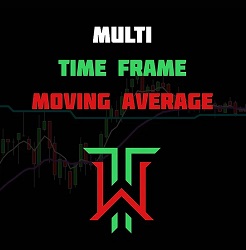
Introducing the Multi Time Frame Moving Average to revolutionize your trading analysis. With this exceptional tool, you gain the ability to visualize a comprehensive array of moving averages derived from various time frames, bar types and average types, all conveniently displayed on a single chart.
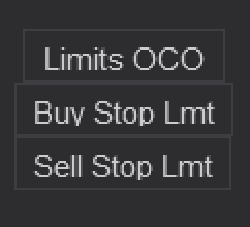
Bars Edge Trader Button and OCO Timer pack for NinjaTrader 8. An easy fast solution to apply Limit Orders to your Chart Trader. Included are three timers for adding OCO Limits entries throughout the day to catch a news cycles semi-automatically.
TradingCoders offers conversion services between NinjaTrader 7, NinjaTrader 8, MetaTrader4, MultiCharts.NET and eSignal (among others). Have your NinjaTrader indicators or strategies converted from NinjaTrader 7 to version 8, or move your formulas to NinjaTrader from another platform!
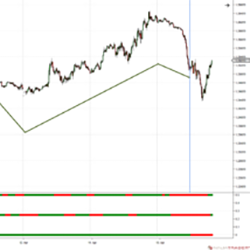
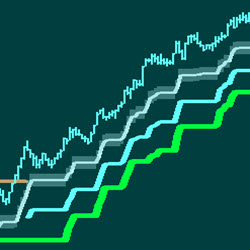
The EnlightCoders HeadScalper gives you market direction with a traffic light plot – red or green. SAT (Scalp Auto Trend) is a versatile and self-adapting tool to identify what is happening in the big picture. It reduces noise with smart filters and shows just one thing: the trend in red or green.
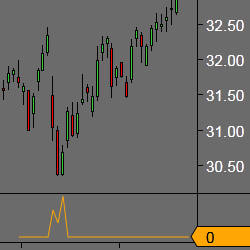
Precision Divergence Finder is designed to find bullish divergences in Demand Index readings in real time with no delay or re-painting. It can often pinpoint precise market bottoms and using this product can give you the insight needed to increase the chances of finding the exact market low point.
Unlock the secrets to market mastery with this 100% free indicator combo. Designed to sharpen your trading and boost your consistency – all with zero cost. Benefit from this comprehensive training and achieve reliable results swiftly. No repaints, just unwavering accuracy!
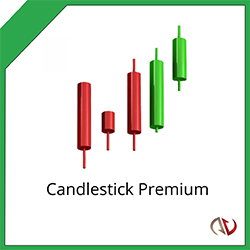
Trade smarter with multiple candlestick patterns. This indicator uses pattern recognition to scan for 16 different candlestick patterns. It detects bullish, bearish and gap patterns. It can be used with Bloodhound and NinjaTrader's Market Analyzer.
The ATR Stop is a simple but powerful tool to help the trader stay in a position longer and with greater confidence. Employs a proprietary “filter” to eliminate “false positives.” PTG ATR Stop Indicator is your confidence builder. Ask about PTG's Auto-Trade Assistant (ATA) Strategy.
December 2, 2024
Mastering Sideways Markets With Auction Bars and Range Projections
November 19, 2024
Enhancing Your Automated Trading System: Key Insights from Best Pro Trade
November 14, 2024
NinjaTrader New Ecosystem Tools: October 2024 Edition
Enter Email for Updates