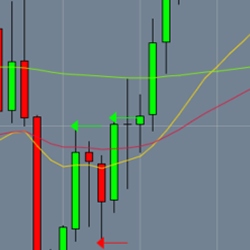
One minute chart entry indicator after a trend reversal on the 5-minute chart. The indicator looks for the first entry after hitting the 20EMA, and a W bottom or M top depending on the direction afterward. All that is needed is a 20EMA on the 5-minute, and a 20EMA and 200EMA on the one minute.
Tradesight posts regular weekly market previews and trade recaps on their YouTube page. The service is free.
Semi-auto trading tool used to help enter and manage trades when using Renko style charts. Customize entry condition, stops, targets, breakeven and trail.
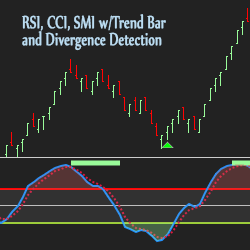
Use UppDnn.com’s Momentum Indicators to identify divergence and momentum changes as signals emerge at reversal areas. These upgraded indicators include Relative Strength Index (RSI) with Divergence Detection, Commodity Channel Index (CCI) and Stochastic Momentum Index (SMI) with a Trend Bar.
The FiReZ Trading Strategy is an original and modern refinement of Fibonacci technical analysis. This Fibonacci trading strategy may be the last strategy that you'll need to learn. Stop making trading complicated and learn how to analyze and trade in a simplified, structured, and repeatable system.
The Volume Profile Learning Pack includes 44 in-depth training videos, 15 hours of video content and hundreds of real trade examples, including forex, futures, indexes, and stocks. It also includes custom-built Volume Profile indicators for NinjaTrader 8.
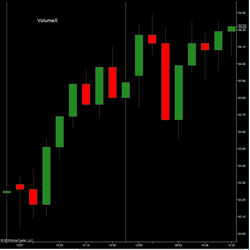
The LogikVolumeX utilizes signal processing and price reconstruction techniques to cut through the noise, reconstructing the true transaction, minimizing the hiding of large orders. This allows traders to identify & react to the market sentiment, and correlation between price & volume development.
EPyFClimaxVolume is an indicator which designates climax areas within intraday charts. It also identifies important entry & target levels for day trading. You can customize the indicator levels within each chart.
100% FREE - The TAS Market Map Indicator delivers the most visually appealing customizable market profile tool for traders. Its color-coded sideways histograms clearly reveal volume at price, value areas (red zones), master point of control lines (aqua lines), gaps and congestion.
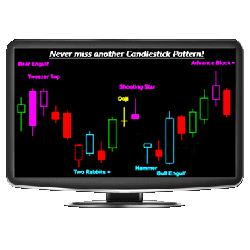
Want to scan for any candlestick pattern, on any timeframe, across any list of symbols? Whether you're interested in the most common or advanced patterns, the Candlestick X-Ray™ detects over 90 unique candlestick patterns, making it a highly flexible and powerful candlestick pattern tool.
December 2, 2024
Mastering Sideways Markets With Auction Bars and Range Projections
November 19, 2024
Enhancing Your Automated Trading System: Key Insights from Best Pro Trade
November 14, 2024
NinjaTrader New Ecosystem Tools: October 2024 Edition
Enter Email for Updates