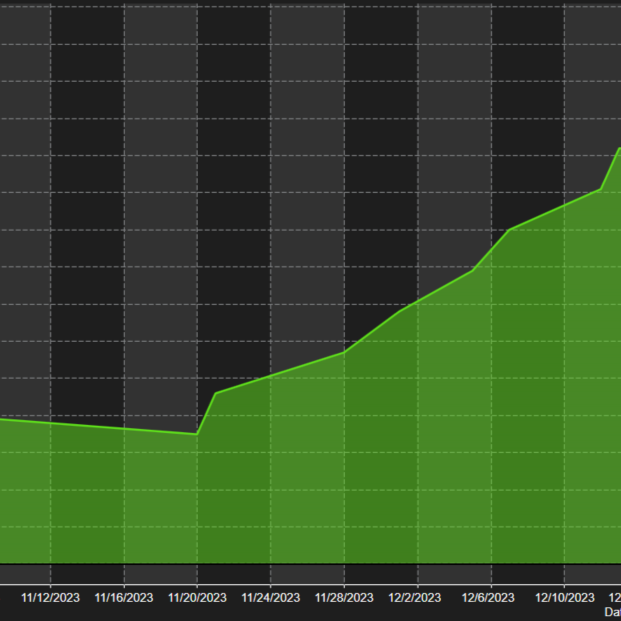
Elevated trading with precision and autonomy. Trade smarter, hands-free! Does not activate everyday as it is looking for specific market opportunities.
Day Trading Course with Order Flow analysis and live trading sessions.
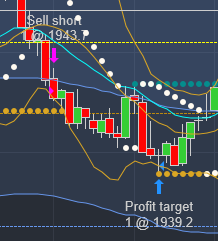
Daily trade strategy briefing (S&P 500 e-mini (ES) and Nasdaq 100 (NQ) futures). Two-week free trial. This daily email report is published "pre-RTH" session so traders can be prepared and have an actionable trade strategy plan with relevant probability price targets for the current session.
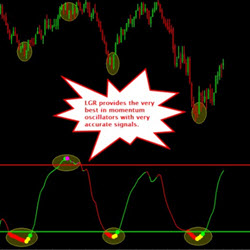
The LGR is a composite Triple Momentum Index Oscillator. LGR indicator is a proprietary design that gives the trader the crème de la crème of momentum oscillators by combining into a single indicator. No more figuring out which oscillator to choose.
2 Cores (Intel Xeon E-3.70GHz), 4GB DDR4 RAM, 40GB NVMe SSD, 1x Dedicated IP address, Windows 2019, Free Installation, Unlimited Traffic, RDP/iOS/Android/Mac/Parallel access, Supports All FUTURES Platforms, CLOUD Anti-Virus & Malware Protection, Immediate Activation
The system looks for the highest high and lowest low over past bars, then the system tags the entry with a line that is proportional to your entry settings. Then the strategy calculates: Imbalance, velocity, momentum and probability.
This automated trading strategy is designed for the Russell 2000 futures market. The strategy is easy to use, making it suitable for both experienced traders and beginners. Find out more on www.russell2000strategy.com.
Created to help aid momentum-style charting in finding support and resistance lines. It was specifically made for the ES when plotted with tick bars. This tool may help cut down on chart preparation time or get your chart caught back up if busy multi-tasking.
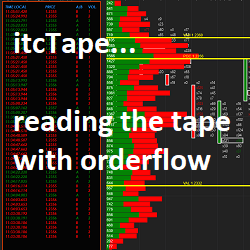
itcTape is a powerful indicator to read the tape & find precise entries in the market. Tape reading is used to follow institutional moves & go along with them. It is used by scalpers as well as by swing traders. The itcTape indicator is highly customizable by size, colors, filter & more.
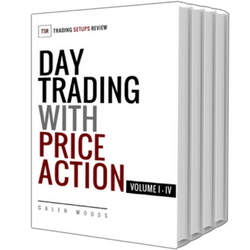
Trend lines, swing pivots, and price patterns are simple price action trading tools that seasoned traders use daily. Day Trading With Price Action, by Galen Woods, is a high-quality trading course that teaches how to effectively trade via price action analysis. Download a free chapter today!
December 2, 2024
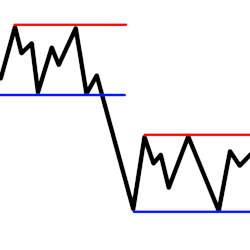
Mastering Sideways Markets With Auction Bars and Range Projections
November 19, 2024
Enhancing Your Automated Trading System: Key Insights from Best Pro Trade
November 14, 2024
NinjaTrader New Ecosystem Tools: October 2024 Edition
Enter Email for Updates