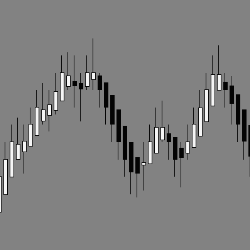
EPyFBarsType is a tick-based bar, unlike time-based bars such as regular Japanese candles. These bars are one of the main components of our system, due to the objectivity they provide for technical analysis. This bar type helps in identifying market moves and avoiding choppy areas.
An easy-to-use order flow and volume profiling tool for NinjaTrader 8. The goal is to present order flow in a simple, clear way that also performs well in volatile markets. Numbers are not key here, visuals are. Algo helpers and trade execution assist included. Always evolving! Trial available.
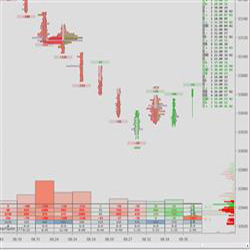
OTM Volume Profile is essential to understand the auction behavior and find key price reaction zones, such as the VPO, high and low value area. This profile preserves and allows to visualize these levels historically, which distinguishes it from static profiles.
A traditional Gann Fan with upgraded features. Save time with the Speedkey onscreen task command buttons. Derive better leading edge, price action information from your Gann Analysis, including support and resistance identification and real-time price momentum information. Contact for a free trial.
Funded trader evaluation program reviews and recommendations. Get honest information about various companies like TopStep, Earn2Trade, Leeloo Trading, UProfit Trader and OneUp Trader from someone who has been funded by several companies. Discover current deals and promos.
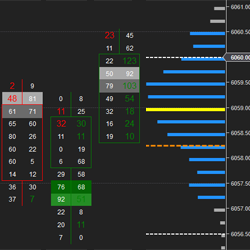
Order Flow is the study of tick-by-tick volume for trading Futures, Forex and Equities. The OFA toolset provides custom charts and advanced drag-and-drop profiling features designed to easily identify precision entries and targets. Get started with a free order flow training class today!
Custom design. Custom actions. Create buttons that interact with standard NinjaTrader ATM strategy orders. Fully customizable, including button and font color and size as well as button width and position. Actions can be based on a wide variety of reference prices and offsets.
GAP/VWAP Fail is one of Scott's favorite stock setups that can be also applied to futures. A frequent & highly favorable risk-reward play that finds an additional edge by understanding order flow, watch Scott explain it in detail & demonstrate with multiple examples including entry & exit rules.
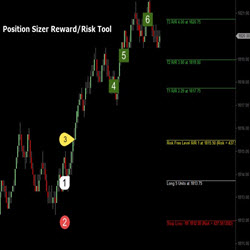
This tool auto-calculates position size based upon account value and percentage risk parameters input by trader. Displays the Entry Price, Stop Loss, and up to Three (3) Price Targets based on R-values. If you a serious trader, then this is an essential addition to your trader toolbox.
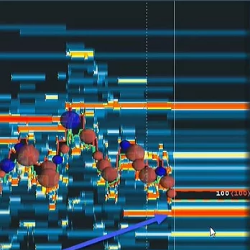
The Volatility Bands indicator attempts to present a way to measure and visualize volatility, using standard deviations (σ) and average true range indicator, and aims to point out areas that might indicate potential trading opportunities. Click to learn more.
December 2, 2024
Mastering Sideways Markets With Auction Bars and Range Projections
November 19, 2024
Enhancing Your Automated Trading System: Key Insights from Best Pro Trade
November 14, 2024
NinjaTrader New Ecosystem Tools: October 2024 Edition
Enter Email for Updates