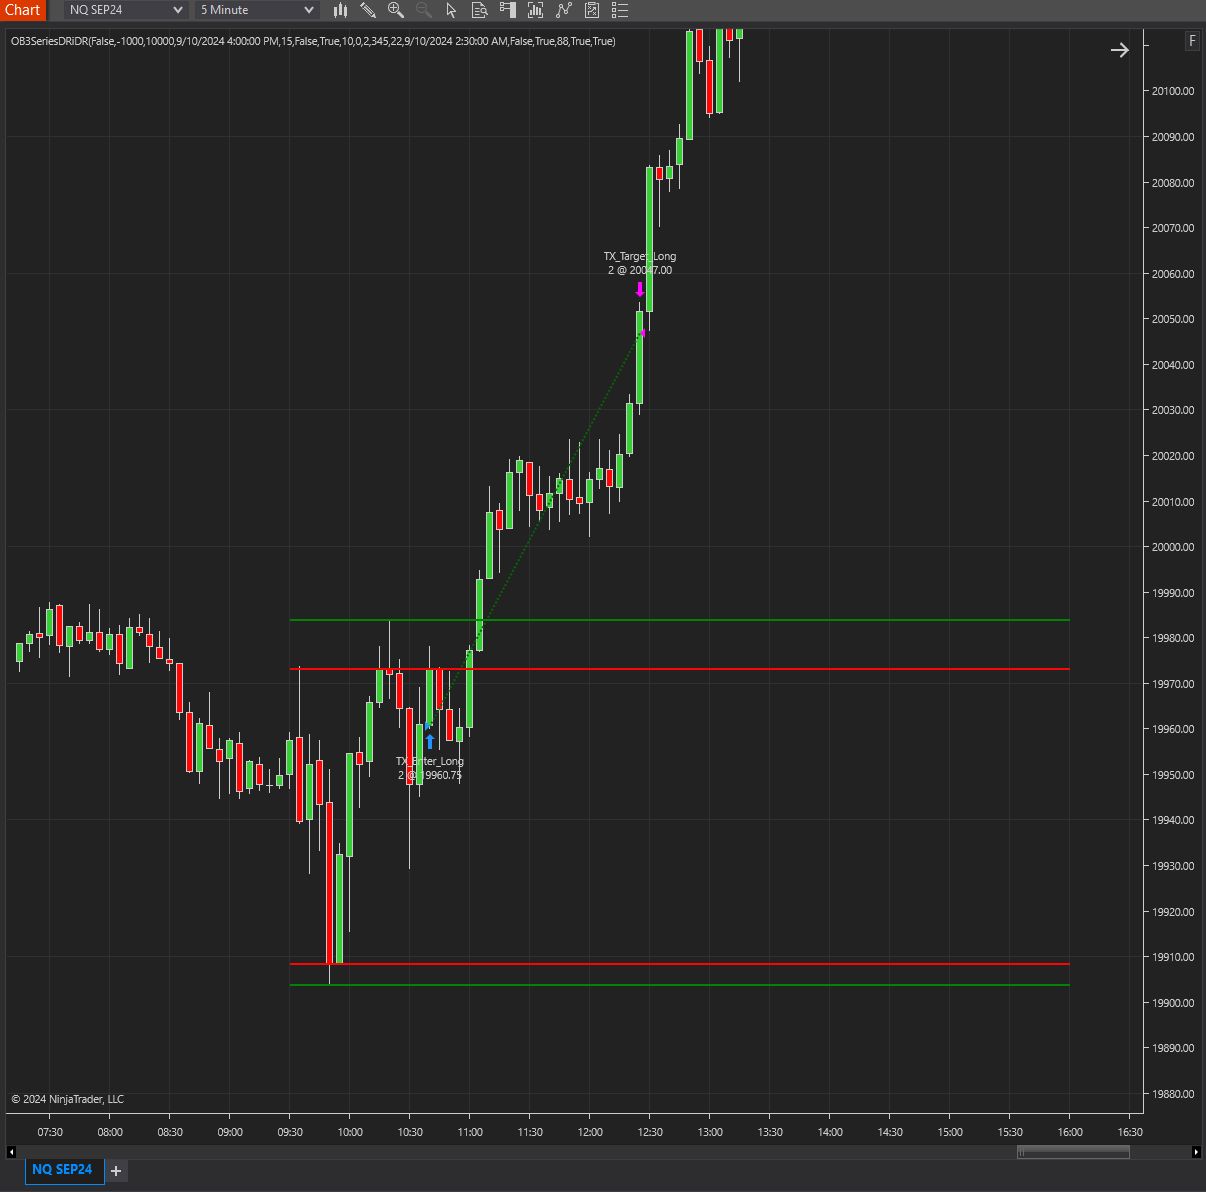
The purpose of this indicator is to automatically plot critical support and resistance levels on a chart. The Critical Support & Resistance Level Indicator comes with customizable alerts and can be added as a Market Analyzer column.
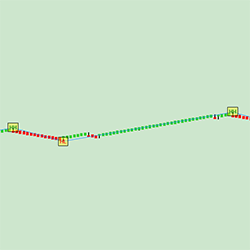
The DR/iDR strategy works by calculating the high, low, and close prices during the critical first hour of trading (9:30–10:30 AM) to determine the Daily Range. It then generates Implied Daily Range levels based on this data, providing clear markers for potential breakout or reversal zones.
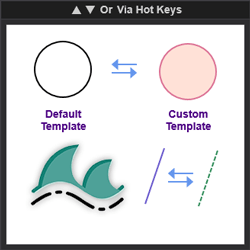
This savvy tool is for any intraday trader who draws lines and prizes accuracy when plotting, templating and reviewing line break information across multiple intraday timeframes. Our template tool also features the 5 standard next-gen and time saving features of the CT_Signature Fan Series.
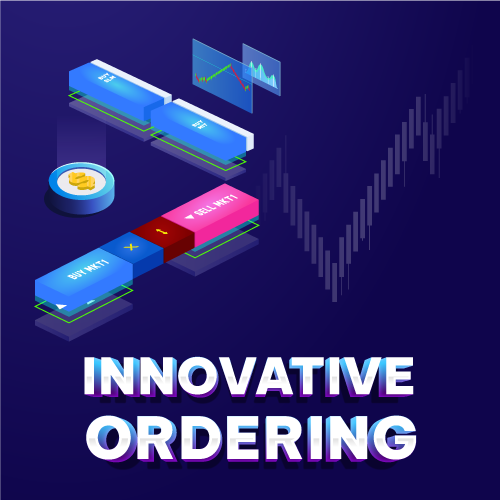
Ideal for those wanting to place pending orders with a single click, execute lightning-fast market orders, or simplify trading for users with slower computers or impaired eyesight. Key features include support for various order types, quantity presets, ATM selector, and real-time status display.
This indicator allows the user to switch a draw object's template on the fly without having to dig through various menus. This increases application functionality and user charting efficiency.
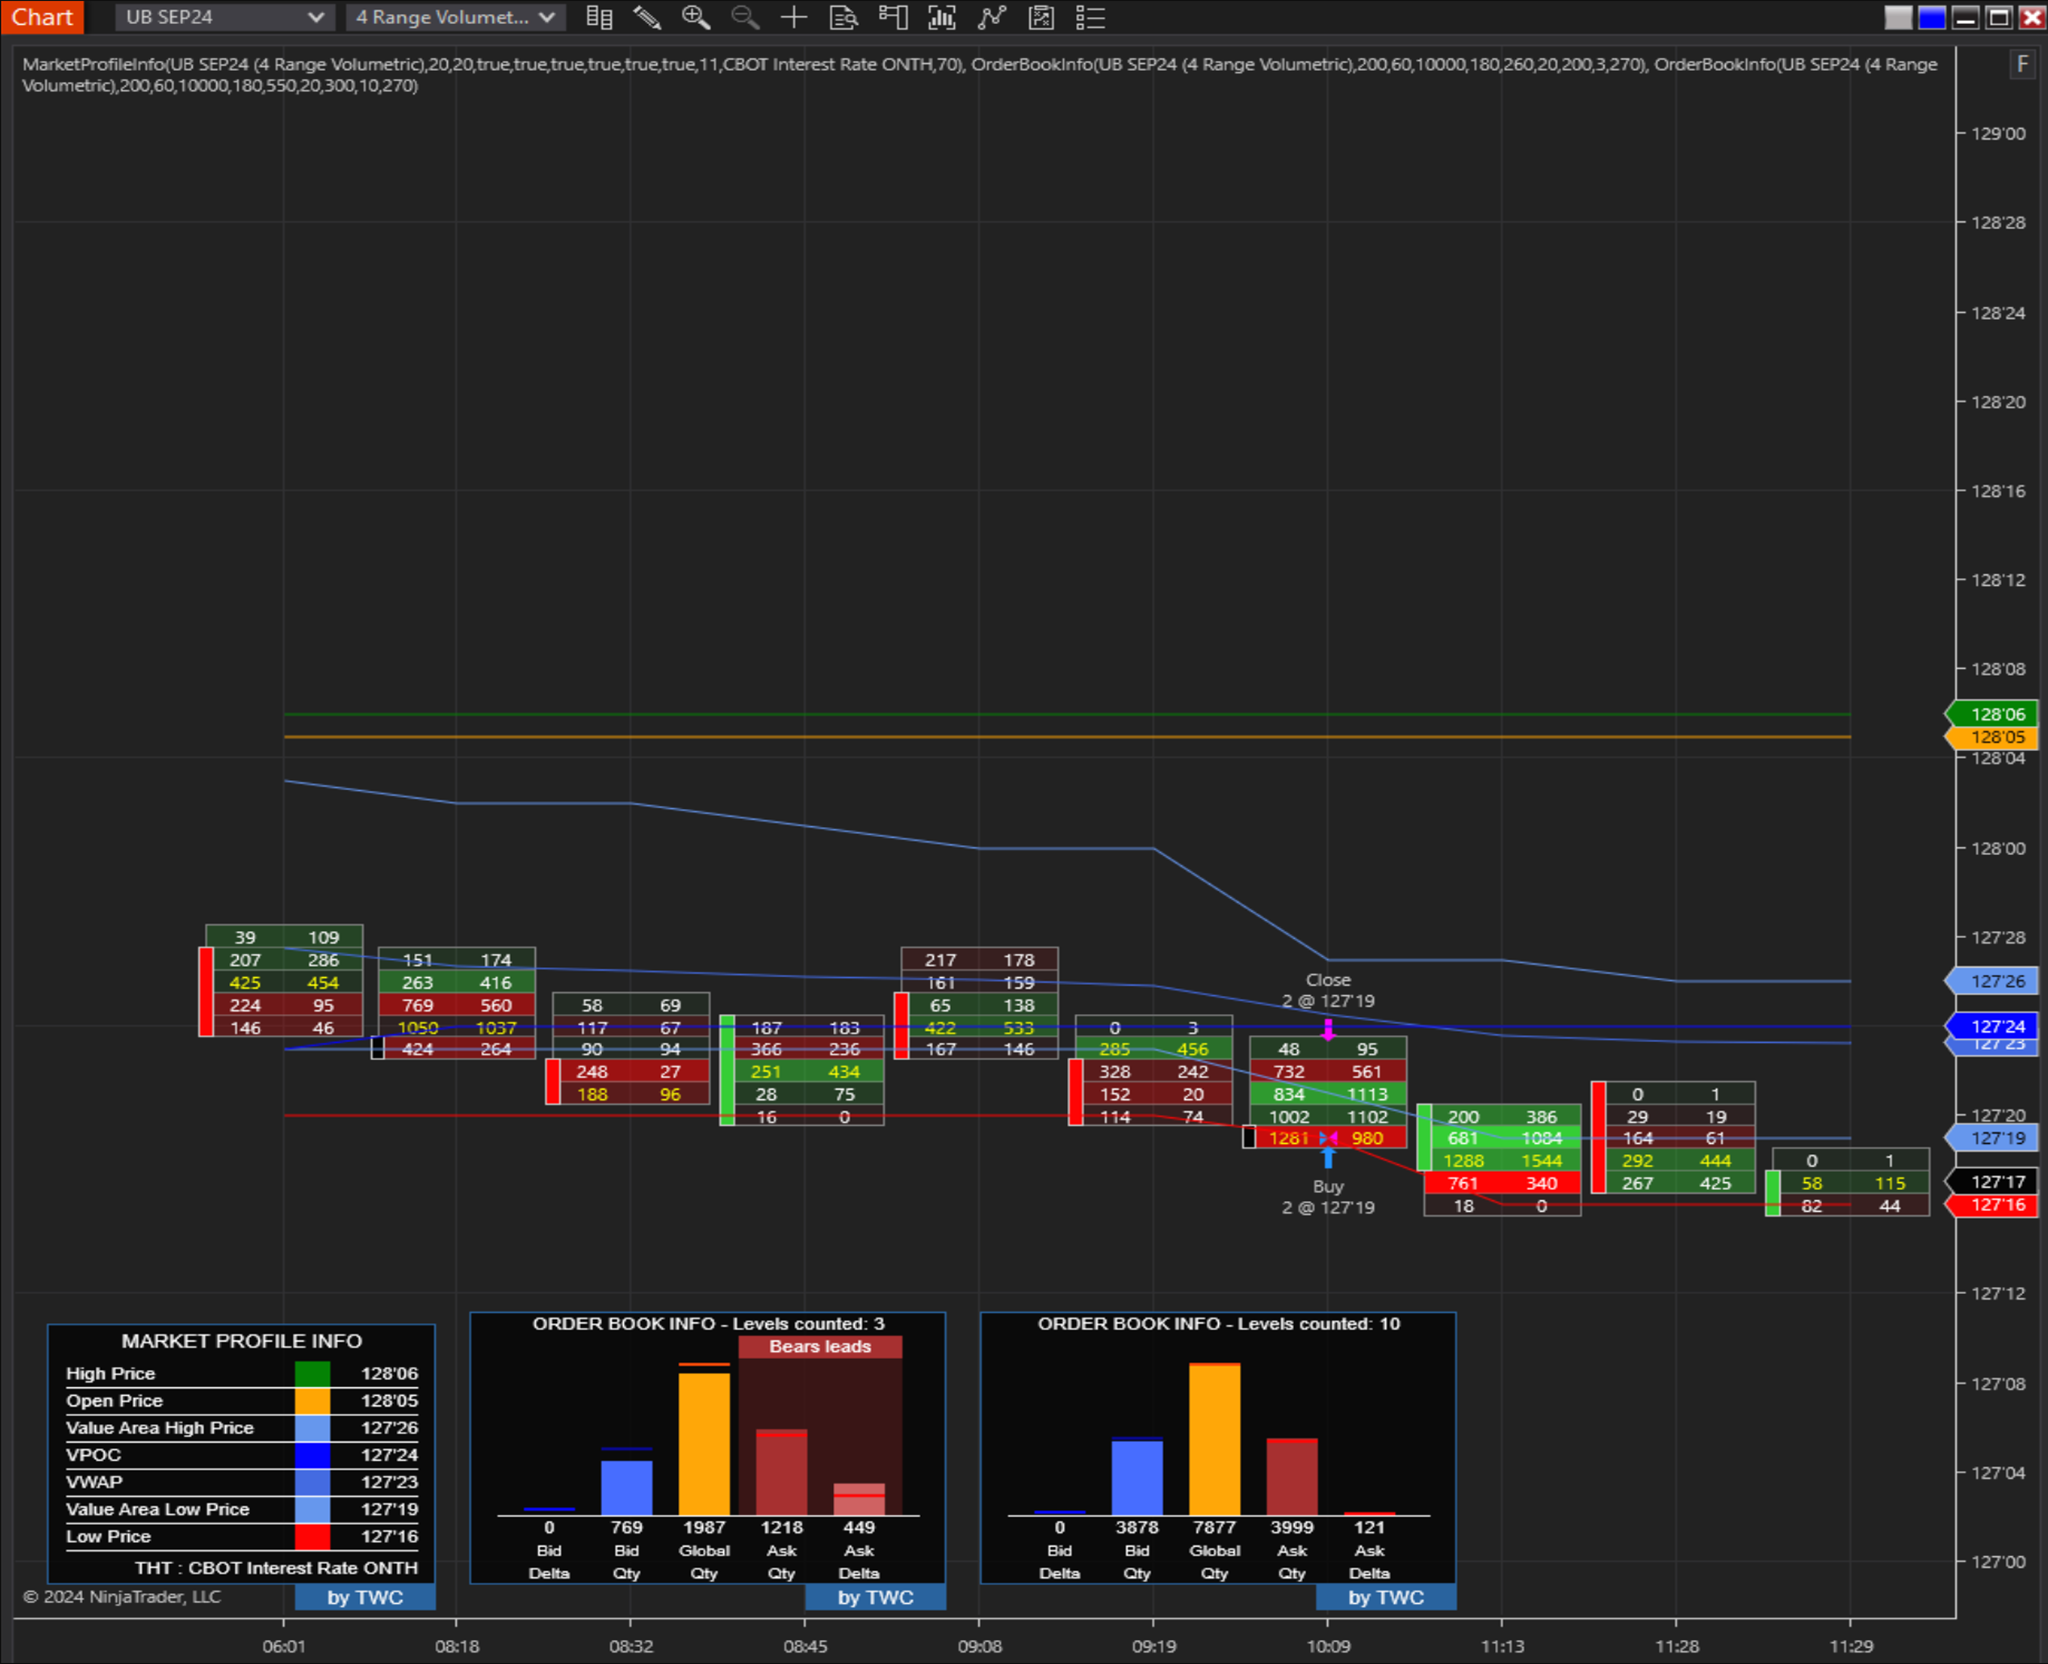
The power of TWC Market Profile Info and TWC Order Book Info. Traders gain a clear understanding of market dynamics. The Market Profile tool provides critical insights into key market points and trends, while the Order Book tool offers real-time visualization of order flow dynamics.
The indicator employs a proprietary algorithm, generating highly reliable signals in trending markets, leading to more confident trade decisions. The indicator's clouds move dynamically in tandem with market trends, offering a visually comfortable representation of market conditions.
Pattern MNTrader is a fully automated trading system. Trading is conducted based on trading patterns, support and resistance lines, Fibonacci lines and trend lines. This unique combination of tools creates an innovative system of support positions with flexible settings.
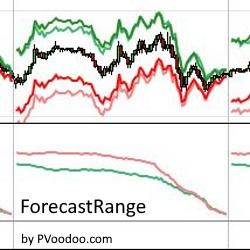
The PVForecastRange indicator calculates price moves and sets targets based on previous days’ statistical volatility. Try it for free!
You can use this crème de la crème indicator to determine the dominant direction of price action and trend. It can be used on multiple timeframes for identifying qualities that must be present before a trade is considered.
December 2, 2024
Mastering Sideways Markets With Auction Bars and Range Projections
November 19, 2024
Enhancing Your Automated Trading System: Key Insights from Best Pro Trade
November 14, 2024
NinjaTrader New Ecosystem Tools: October 2024 Edition
Enter Email for Updates