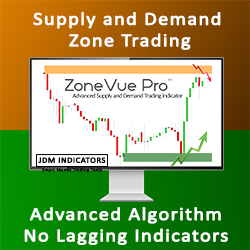
ZoneVue Pro, an advanced Supply & Demand Indicator, giving you the edge you've been looking for! Identify quality zones from price action to order flow, identifying pending orders from banks and intuitions. No lagging indicators. Trade like a sniper. Transform your trading!
The algorithm executes trades based on previously designed and projected levels from previous day to the next, providing a clear and predictable market structure and the trade it will be able to perform.
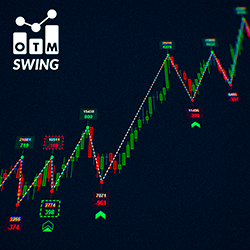
OTM Delta Swing offers advanced analysis of price wave movements, displaying volume and delta to assess the strength of each wave. Its algorithms detect anomalies and provide real-time informative signals, helping you identify unusual events and gain an edge in the market.
Get the latest knowledge for independent traders to help them create custom tools, and processes and develop the mind needed for a successful trading career. Learn a unique technical analysis method and build trading strategies with a known edge, using a computer-based statistical approach.
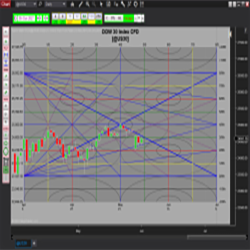
Samri Math Price-in-Time is a comprehensive tool for traders using Murrey Math methodology. This indicator calculates not just PRICE levels, but also sets the price in TIME. Easily switch between time frames (day or minute only) with the user-friendly interface.
Bell R-Delta Alert provides a 360 degree microscopic view of the markets and is particularly designed for Scalpers, Intraday and short term players. The Bell R-Delta features onscreen, audio and email alerts!
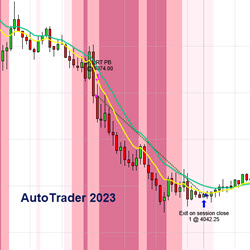
The AutoTrader 2023 system offers automated trading strategies, covering a broad range of trading risk profiles; indicators, backgrounds and a powerful money management module to protect profit and principal are also included. Lease includes training and support.
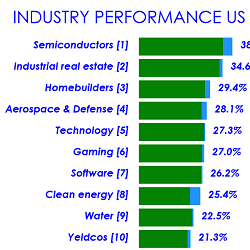
itcIndustryScanner is a NinjaTrader 8 indicator which scans all industry sectors of the US market and displays the strongest and weakest sectors. This screener is used to identify the best performing stocks in strong sectors. It requires a datafeed for NYSE & NASDAQ to analyze the market.
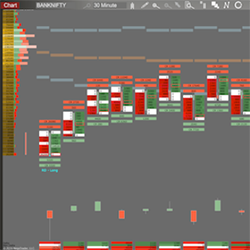
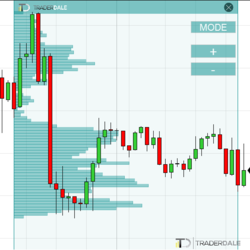
TD’s Flexible Volume Profile helps to reveal institutional trading activity and identifies the strongest support and resistance zones. The use of tick volume data makes it extremely precise, pointing to potential entries. It is easy to learn and simple to use.
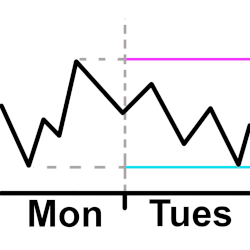
Plot a horizontal line for the high and low from the previous intraday. The user configures the open and close time they want to use for the intraday hours. This means the user can plot the high and low starting 30 minutes before the actual open and after the actual close if they want to.
December 2, 2024
Mastering Sideways Markets With Auction Bars and Range Projections
November 19, 2024
Enhancing Your Automated Trading System: Key Insights from Best Pro Trade
November 14, 2024
NinjaTrader New Ecosystem Tools: October 2024 Edition
Enter Email for Updates