The Spread Trading Tool add on for NinjaTrader 8 allows for charting a variety of spread combinations from 2 leg 1:1 ratio spreads to more advanced butterfly spreads. A control panel connected to the strategy allows for easy entry and management of spread trades.
PoshTrader is a fintech company based in Estonia that specializes in custom development and out-of-box solutions for traders. We convert, retain and increase the lifetime value of trading platforms. Our work focuses on enhancing the trader's experience and performance.
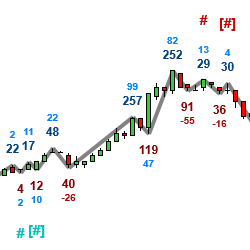
MBoxWave Algorithmic Buy / Sell Signals use Wyckoff concepts in analyzing waves, volume, delta volume, effort / result, etc... It allows you to easily scan charts for certain conditions to meet a criteria and then showing a signal that a potential trade setup has occurred.
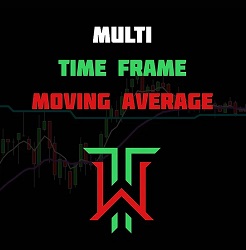
Introducing the Multi Time Frame Moving Average to revolutionize your trading analysis. With this exceptional tool, you gain the ability to visualize a comprehensive array of moving averages derived from various time frames, bar types and average types, all conveniently displayed on a single chart.
Trend Meter is an emerging indicator that combines multiple traditional methods of identifying trend direction in one single indicator. The indicator provides various selections of trend algorithms and allows you to select your favorite five. The indicator will turn green for bull signals.
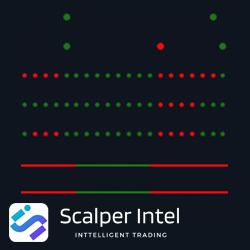
The "Qdirector" is a scalping indicator built to catch explosive movements in price. Easily see high & low momentum periods as the indicator "directs" traders to scalp in strong price moving environments. Traders can adjust the indicator settings to be more or less responsive to price action.
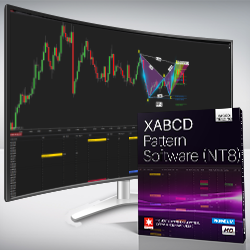
Saving you time is really import to us which is why the XABCD Pattern Suite will scan, find and alert you to XABCD patterns in any market and any timeframe. Once found, the pattern is automatically drawn onto the chart to make things easier. This includes everything you need to learn patterns.
Connect to a remote desktop from work, home or business trips. Monitor your trades from any location. Your automated trading strategies can run 24/7, without the risk of the computer shutting down. 1 GB/S, low latency, Intel Xeon, USA located, 24/7 access.
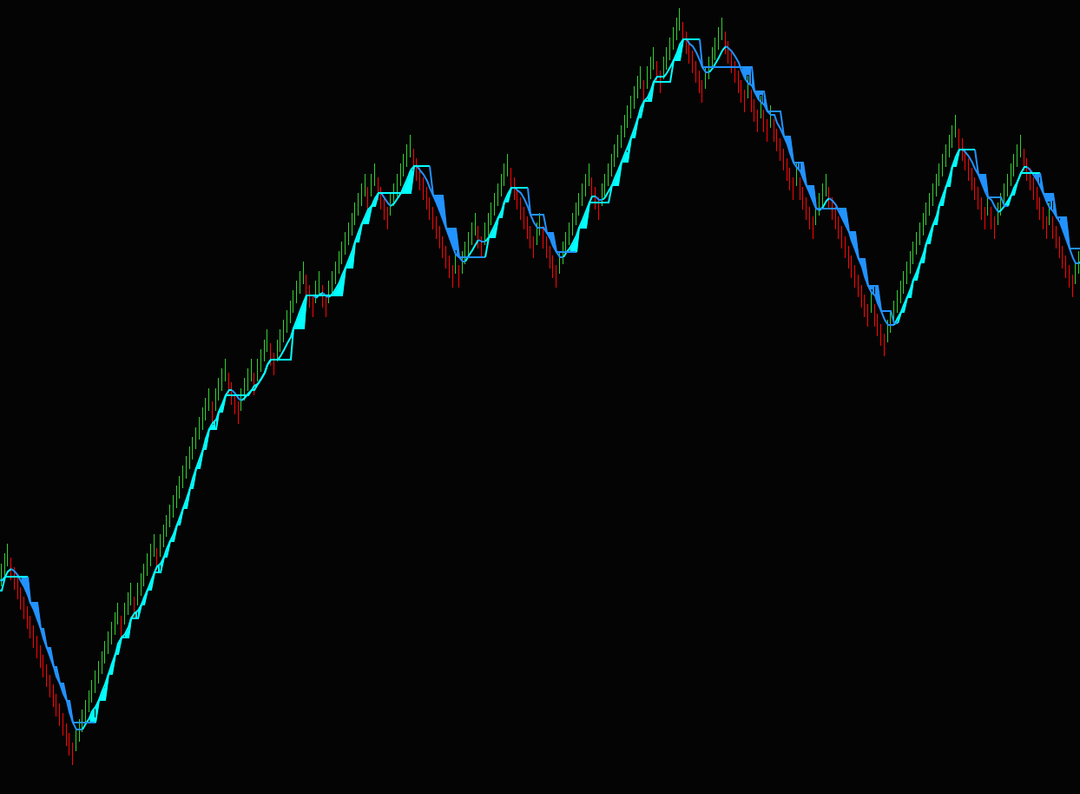
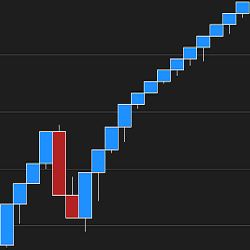
Say goodbye to fixed brick sizes! Optimal Renko Bars' advanced logic auto-selects the smoothest-fit Renko bars for your chart in real time! Dynamic, self-adjusting bar type that responds to today's market.
This trading plan is applicable to futures, stocks, Forex, crypto or any financial instrument. This course will help you to understand a trading model based on price action and risk management. It is an evergreen methodology based on the law of supply and demand.
December 2, 2024
Mastering Sideways Markets With Auction Bars and Range Projections
November 19, 2024
Enhancing Your Automated Trading System: Key Insights from Best Pro Trade
November 14, 2024
NinjaTrader New Ecosystem Tools: October 2024 Edition
Enter Email for Updates