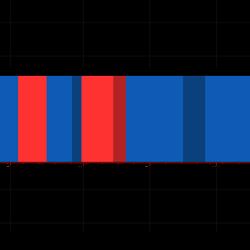
Stay in your trades for longer using our HeatMap indicator. One of the toughest problems can be getting into a trend or staying in a trend until the end. HeatMap looks at 4 factors which determine a trend and displays the results in an easy-to-read heatmap right on your charts.
E-Mini Tutor offers three 1 on 1 Day Trading Education options aimed at traders who are interested in understanding the markets. The Pivot based trading methodologies strive to forecast market moves before they occur empowering traders to work smart, not hard. Enroll today!
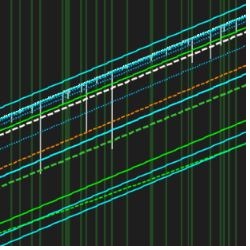
Q-Scalper indicator identifies the confluence dynamics between Support and Resistance levels with significant Trendlines, providing very significant trade levels. These levels produce very actionable and valuable trade set-ups. Click the link to explore this great indicator.
This custom BloodHound template is setup for the UniRenko Bar and waits to trigger signals as the market pulls back into the moving averages. The JATS X-RE-X Blackbox BloodHound Template allows you to execute at the specific EMA entry locations after pullbacks.
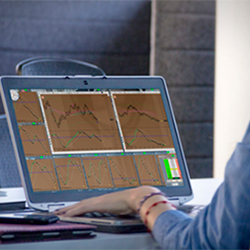
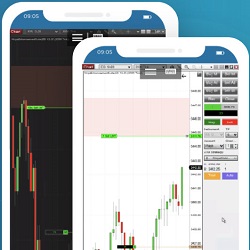
Ninja Mobile Trader VPS allows 24/7 access to NinjaTrader 7 and NinjaTrader 8 across all operating systems (Windows, Mac). Log in from anywhere in the world, any time, on any device (iPhone, Android, tablets, home computers). Start trading on Mobile today!
Identify market inefficiencies by marking fair value gaps (FVGs) on the chart that meet predefined size criteria. The indicator distinguishes between bullish and bearish gaps and changes their color once they are inversed. It provides clear visual cues for potential rejection trades from these gaps.
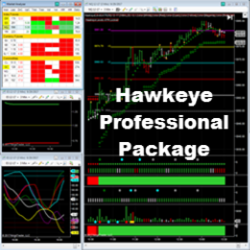
The Hawkeye Professional Package includes all Hawkeye tools for volume spread analysis, on multiple time-frames across all markets. These powerful indicators tell traders when a trend is commencing, in congestion and where to find the correct exit. Buy Now using code: “NT10Off” for a 10% discount.
Don’t let someone else trade your idea first! We know it’s frustrating to have a great idea but not the knowledge to code it. That’s why we, a certified vendor of NinjaTrader, and our team of developers (who have 17 years of coding experience) have helped hundreds of customers. Reach out to us!
Day Trading Radio is a live online market broadcast led by John Kurisko, a full-time trader of nearly 25 years. The show kicks off every morning around 8:30 am (EST) with live trading and technical analysis of the markets in real time. Get trade alerts and trade with 100’s of traders every day.
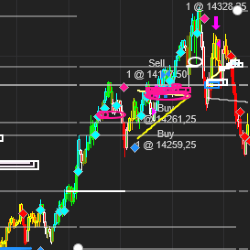
The ultimate semi-auto trading strategy that harnesses the power of a premier indicator, Peaks. This innovative tool gets you into trades, automatically as a signal is generated, eliminating the need for manual entries. Peak's Semi Auto also offers automated exits, using their custom Auto PT logic.
December 2, 2024
Mastering Sideways Markets With Auction Bars and Range Projections
November 19, 2024
Enhancing Your Automated Trading System: Key Insights from Best Pro Trade
November 14, 2024
NinjaTrader New Ecosystem Tools: October 2024 Edition
Enter Email for Updates