Take trendline trading to a new level with the TrendlineProTrader, developed with your favorite trendline tactics including: horizontal, diagonal, channel OCO, and breakout-pullback. It includes automated trade management and traders can use their own indicators. See TrendlineProTrader in action!
Backtest any trading system ever invented ranging from a mechanical system (MA Cross) to a discretionary system (Elliot Wave). The backtesting tool has built in statistics calculations, as well as an easy-to-learn logging system. It works on Futures, Forex or Stocks. Grab a 7-day free trial now!
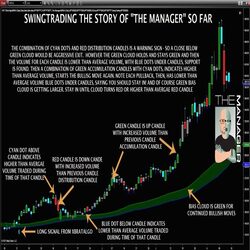
The Manager helps with simple and repeatable trade management. Using a number of tools like average volume, volume distribution or accumulation and an adjustable BIAS cloud, it can help you evaluate whether the market is reversing or just pulling back.
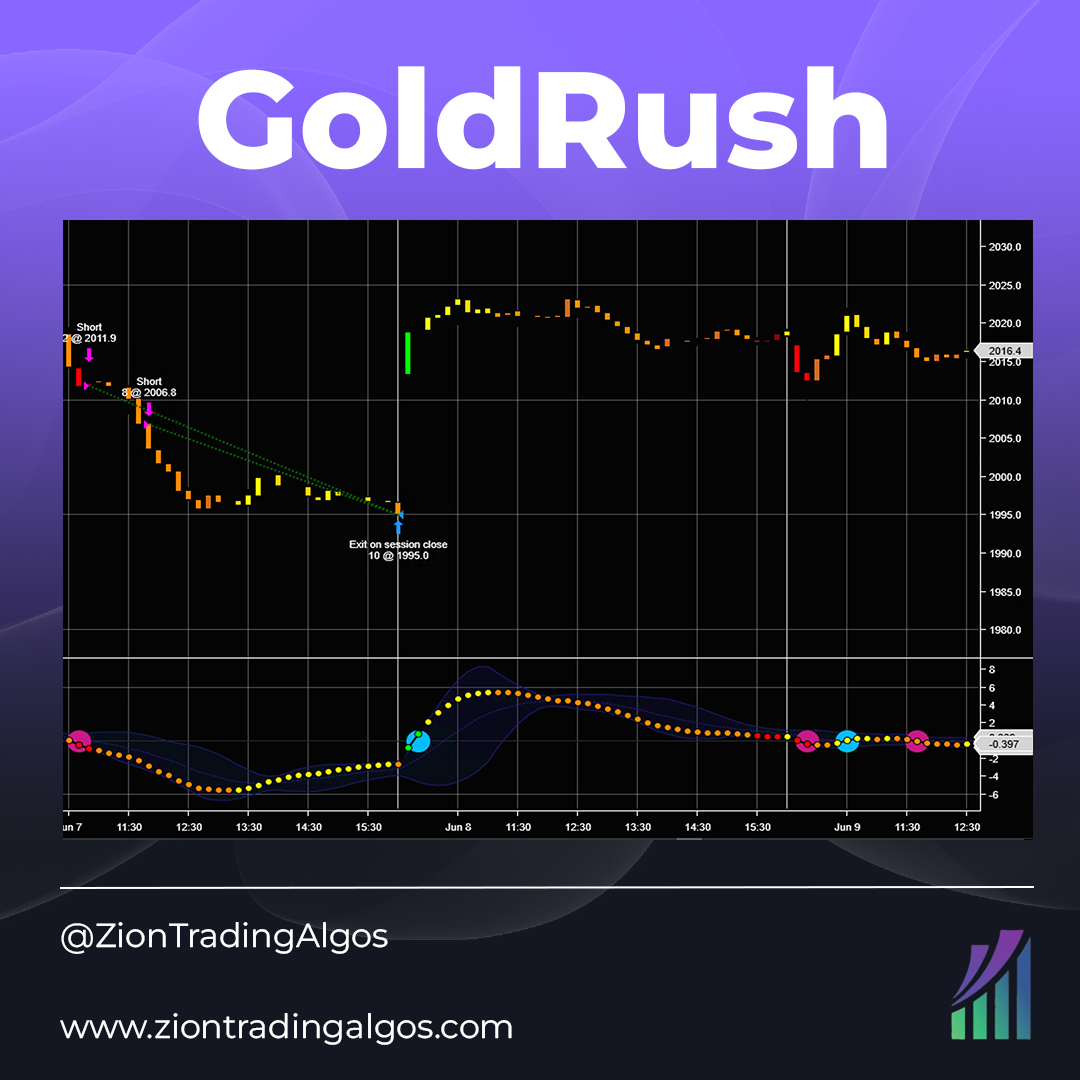
GoldRush is an intraday strategy on the 10-minute chart. Designed to take an initial amount of GC contracts, it uses a few custom indicators that will also be included with purchase.
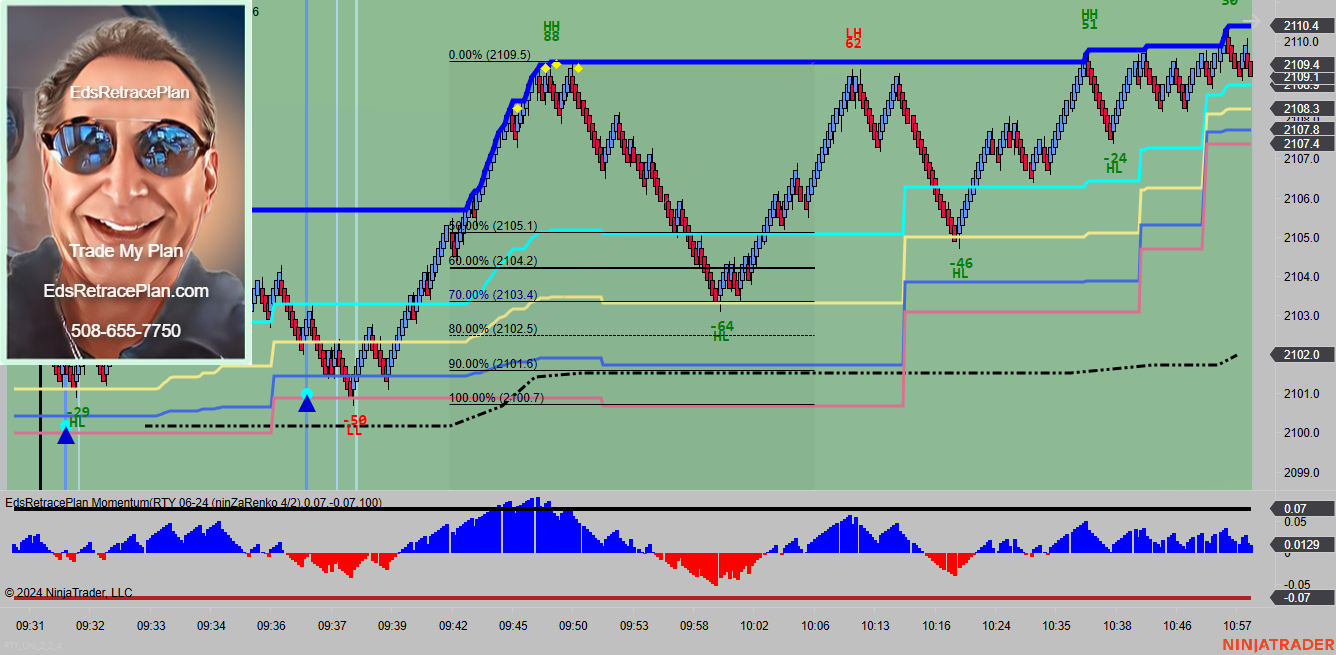
EdsRetracePlan, the innovative system that provides specific day trading signals for ES, YM, RTY, NQ, CL and GC, is now broadcasting live charts to the EdsRetracePlan YouTube channel, daily from 9:00AM to 11:00 EST. For the YouTube URL to this daily show please send an email to [email protected].
Hawkeye Zones add extremely accurate, predictive supply and demand zones (support and resistance) on your charts. Visualize market turning points and break out areas in all markets and timeframes. Buy now using code: “NT10Off” for a 10% discount.
Imagine what it would be like to monitor all 28 currency pairs on one chart. To see trend strength, momentum and congestion revealed instantly and in real time. Throw out your multiple screens and grab your copy now!
OTM Volume Profile is essential to understand the auction behavior and find key price reaction zones, such as the VPO, high and low value area. This profile preserves and allows to visualize these levels historically, which distinguishes it from static profiles.
Elevate your trading strategy with the Day Range Zones Indicator for NinjaTrader 8. Calculate potential daily trading ranges from the opening price using historical data and standard deviations. Identify key support and resistance areas, manage risks, and anticipate price movements.
If you can see when price and momentum have diverged, then you can evaluate when and where price may change directions. The SuperD indicator tracks seven different momentum oscillators. You don't even need to have any of the momentum indicators on your chart!
December 2, 2024
Mastering Sideways Markets With Auction Bars and Range Projections
November 19, 2024
Enhancing Your Automated Trading System: Key Insights from Best Pro Trade
November 14, 2024
NinjaTrader New Ecosystem Tools: October 2024 Edition
Enter Email for Updates