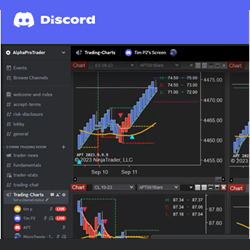
Trading group support and education, live market trading and NinjaTrader 8 add-in for E-mini trading turnkey system: ES, NQ, YM, RTY, CL, GC. Discord trading group for futures NYSE hours. E-mini futures trading, live market trading commentary, charts, mentoring and more.
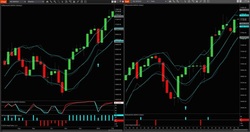
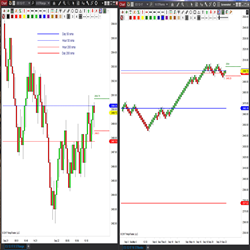
IATrend gives a clear indication of the trend of any financial instrument and does so on all different time frames.
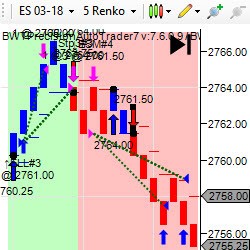
The BWT Precision Autotrader is a state of the art trading tool/software that automates most of the tasks of manual trading, like trail stops, daily goals, entries and profit targets. It uses a universal directional algorithm that brings accuracy, discipline, risk & money management to your trading.
Are you tired of only being able to trade futures manually? We have a fully Otter-mated strategy, so you can make trades while you sleep or do the things you enjoy! Try it now with our special introductory period for your first three months.
The STMA indicator offers traders the ability to auto plot higher timeframe Simple or Exponential Moving Average’s on smaller time framed charts. Learn More about the STMA!
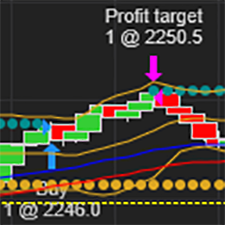
PriceIsKing.com's Futures RAM Indicator is based on a powerful moving average pattern recognition algorithm developed with years of research and testing. Get started with a free 2-week trial today!
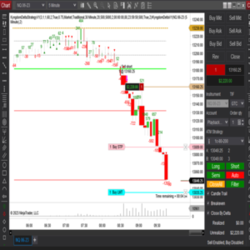
Delta Volume Supply and Demand Indicator that comes with a Semi Auto Chart Trader. Prop firm compliant for evaluations and live accounts. Reads what is happening right now in the market with no lag. Templates, workspaces and manual included. Works in all markets. Free 7-day Trial.
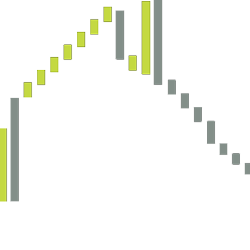
The LogikRenkoStreamline is an improved variant of the traditional Renko Bar type. By granting the ability to set the Reversal Brick size, the bar type will minimize spurious reversal whipsaws.
The platform is responsible for finding multiple patterns in operations and provides statistics which help traders in the decision-making process. Try it now free!
TradesViz is an advanced online trading journal. Auto-sync with NinjaTrader and Tradovate. It includes auto-plotted executions on charts and more than 300 statistics, including MFE, MAE, best-exit analysis and more! Auto-sync with brokers and discover your trading edge!
December 2, 2024
Mastering Sideways Markets With Auction Bars and Range Projections
November 19, 2024
Enhancing Your Automated Trading System: Key Insights from Best Pro Trade
November 14, 2024
NinjaTrader New Ecosystem Tools: October 2024 Edition
Enter Email for Updates