The Historical Volatility Percentile (HVP) is a statistical-based indicator that evaluates the deviation from the average price of an instrument in a given time period. It is usually used to measure the likelihood that a security's price will move away from its current value.
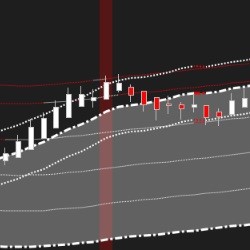
The Linear Regression Trend Lines Indicator dynamically balances the trend on your chart on all time frames. This indicator is built from several linear regression indicators and modified Keltner Channels. Set up to five offset multiplier levels for targets or reversals.
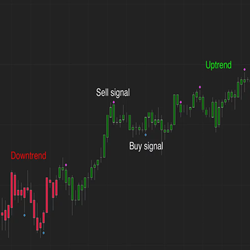
The Q-Indicator provides visual signals of overbought or oversold conditions in the market. Users can enter trades manually or use the indicator in an automated system to take advantage of the various market imbalances.
The world’s first self-optimizing SuperTrend indicator. It uses spearhead third-generation scanning to identify actionable signals. Performance metrics like profit factor and number of winners are displayed on the chart to determine potential results.
Upgrade to the silver plan for enhanced trading capabilities. Get all the features of the bronze plan plus the reference synchronizer module. The reference synchronizer indicator ensures seamless data flow between different charts, including market profile, daily, weekly and monthly charts.
Epic Follow measures an instrument’s correlation to another instrument and, if a big movement is made, triggers a trade. Strategy optimization (templates provided) provide trade setups based on historical performance. It is multi-timeframe and supports futures, equities, and crypto! Download trial!
This is a machine learning/price action-based automated scalping algo. It runs on a custom bar type with multiple price action algos to choose from. Custom control panel allows the trader to control and manipulate the strategy while its running and also manage multiple strategies at once.
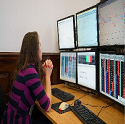
This workshop will help you decide if trading could be for you. It demonstrates all aspects of trading - managing risk, trading techniques, technical analysis, trading psychology, creating a trading plan and what to include. Join in with your laptop or computer.
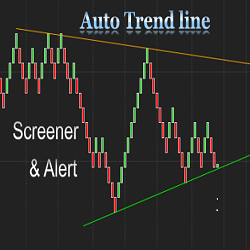
The Auto Trend Line Alert indicator will automatically plot the upper and lower trend lines based on the most recent swing points. It works on all timeframes. The NinjaTrader Market Analyzer makes it possible to track price action related to trend lines in any timeframe.
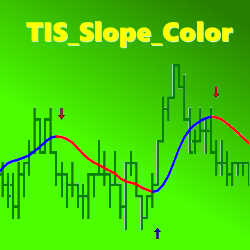
The TIS_Slope_Color indicator allows traders to detect the slope change of any line from any indicator. It can then paint the line, the background, or paint entry signals on a chart.
March 25, 2024
Trading Pullbacks and Reversals: Simplifying a Once Complex Retail Trading Strategy
March 21, 2024
VWAP Indicator: Average Price Shown Based on Price, Volume
March 18, 2024
Trade Copier Strategies: Make Efficiency Work for You When Futures Trading
Enter Email for Updates