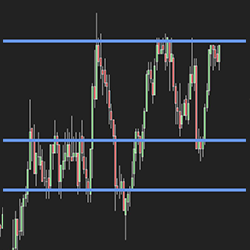
Support/Resistance Levels can be tedious to look for. You have to go back on your chart (with a changing Y axis), and it can be hard to spot every significant point of contact. Tyche Trading’s Automatic S/R Indicator eliminates that with a high level of precision. Get a seven-day free trial today!
edgeful breaks down market data into easy to read reports that instantly show you how any asset behaves, down to a specific weekday. They have all the breakdowns to tell traders when to size into a trade, when to size down, and even where to set your profit targets, based on the data, not opinions."
The Intentional Trader’s most popular "heads-up display" indicator. Get a signal when a confluence of order flow, price action, divergence and exhaustion indicate that price could pullback from the current trend. See this indicator in action with a five-day trading room free trial.
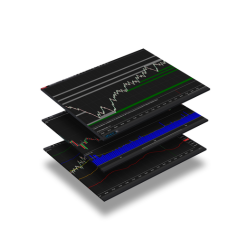
Suite of four complementary indicators provides entry and exit alerts while offering valuable price momentum insights. These indicators can be integrated with your preferred setups and present price momentum in a visually engaging, color-coded format.
A precise analytical tool derived from statistical trading metrics such as prices and volume, offering insights to inform trading decisions.
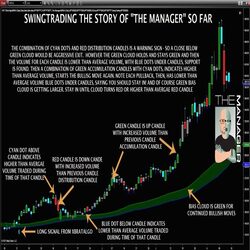
The Manager helps with simple and repeatable trade management. Using a number of tools like average volume, volume distribution or accumulation and an adjustable BIAS cloud, it can help you evaluate whether the market is reversing or just pulling back.
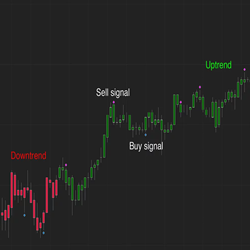
The Q-Indicator provides visual signals of overbought or oversold conditions in the market. Users can enter trades manually or use the indicator in an automated system to take advantage of the various market imbalances.
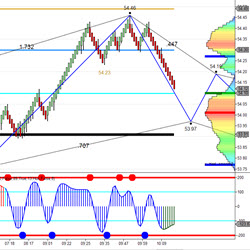
The indicator produces a Fibar signal based on three criteria: a reversal bar, retracement, and subsequent price return. Specifically designed for the KingRenko$ bar, it stands as an indispensable tool for making precise scalping decisions.
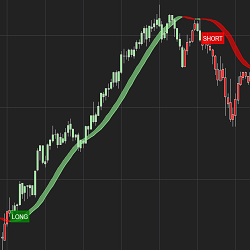
The HolyGrail Algo uses calculations of the Hull Exponential Moving Average to identify market direction. A long or short condition is printed on the chart and the strategy executes the trade by going long or short. You can set defined take profit, stop loss and trail and time of day to trade.
Polaris Trading Group provides futures day trading education that includes an Online Study Course & Live Trading Room. Trading veteran and Commodity Trading Advisor (CTA), David D Dube, provides traders specific support & resistance levels & trade setups based on Market Profile and volume analysis.
December 2, 2024
Mastering Sideways Markets With Auction Bars and Range Projections
November 19, 2024
Enhancing Your Automated Trading System: Key Insights from Best Pro Trade
November 14, 2024
NinjaTrader New Ecosystem Tools: October 2024 Edition
Enter Email for Updates