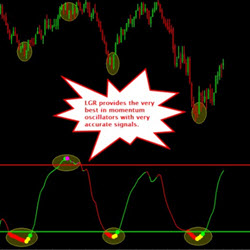
The LGR is a composite Triple Momentum Index Oscillator. LGR indicator is a proprietary design that gives the trader the crème de la crème of momentum oscillators by combining into a single indicator. No more figuring out which oscillator to choose.
Know that you’re an amazing trader but finding the funds to get started is the one thing standing in your way? At UProfitTrader, we can help! Simply choose the size account you’d like, show us what you’ve got through our unique testing process, then start turning your passion into a profession.
The Viper Pro Ultimate Trading Room is open for the first two hours of each trading day - Monday through Friday. Each morning, literally hundreds of traders from all over the US and throughout the world actively participate in these live market trading sessions. Live trade calls are made on as many as nine futures instruments.
Innovative Trading Solutions has been building indicators, fully-automated or ATM Strategies, chart types, and chart styles to client specifications for over 8 years. They also offer NinjaTrader 7 to NinjaTrader 8 conversion services. Get a free quote for your project today!
The Tradesight Seeker and Comber tools for NinjaTrader use a specific bar counting approach to measure exhaustion points. The tools work on all charts and in the Market Analyzer in NinjaTrader.
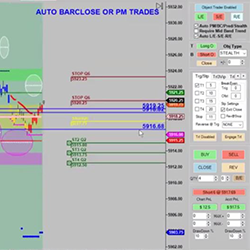
The Stock Index Trading Room is a product of Robbins World Cup Champion Trader Rob Mitchell. It has a unique Scientific approach with Trading Signals, Indicator applications using Market Profile, Price Action, Order Flow, Momentum, Order Flow Momentum, Support Resistance, Market Mapping and more.
In the rapidly evolving landscape of the stock market, traditional trading strategies and indicators often fall short in the face of complex and volatile market conditions. This is where Artificial Intelligence (AI) steps in, revolutionizing the way investors approach trading.
The Job Pivot is a volume profile analysis that allows the user to gauge a directional bias with price targets. It provides an equilibrium between buyers and sellers for the purpose of identifying control of the session’s auction.
The market efficiency is an oscillator-based gauge which monitors bid and offer information in an adaptive sequence. By monitoring such action, the user will be able to determine efficient (directional) or inefficient (turning) price action.
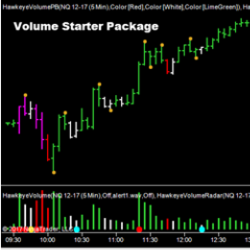
Hawkeye Starter Package is an immensely powerful leading indicator that performs over 300 calculations per bar to analyze the price action and associated volume, signaling price movement prior to it happening. Buy the Hawkeye Starter Package now at its affordable low price!
December 2, 2024
Mastering Sideways Markets With Auction Bars and Range Projections
November 19, 2024
Enhancing Your Automated Trading System: Key Insights from Best Pro Trade
November 14, 2024
NinjaTrader New Ecosystem Tools: October 2024 Edition
Enter Email for Updates