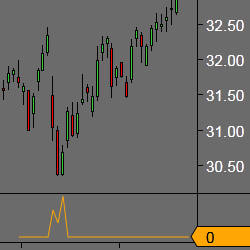
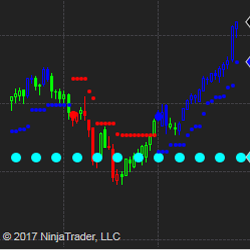
Precision Divergence Finder is designed to find bullish divergences in Demand Index readings in real time with no delay or re-painting. It can often pinpoint precise market bottoms and using this product can give you the insight needed to increase the chances of finding the exact market low point.
If you're still guessing what tick speed to use as an intraday trader, stop now, and start using the Tickspeedometer. The indicator instantly reveals the correct tick chart setting for all instruments and timeframes throughout the trading session. So, stop guessing, & start trading with precision!
Choose from an assortment of indicators with enhancements not found anywhere else. (Digital Clock, Bar Timer, Divergence, Price Channel, Current Bar Range). Get free trials of these unique indicators now!
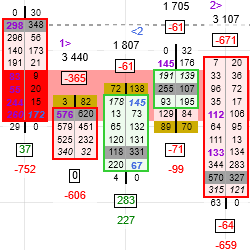
GomOrderflowPro displays the following data: sells, buys, delta & the associated calculations. It computes buy/sell imbalances & builds the associated support and resistance zones. The plots are available for building strategies or populating the Market Analyzer window. Free 2-week trial available.
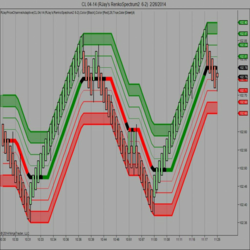
AbleTrend offers a time-tested color-coded trading system featuring dynamic support and resistance indicators that produces buy, sell and exit trade signals. It can be used on any timeframe in the stocks, futures and forex markets. Get started with a 30-day trial for $79 today!
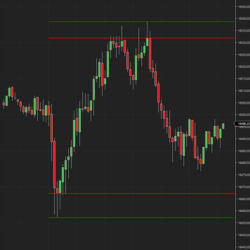
The Angels and Demons Indicator shows current and past support and resistance levels. It can be applied to multiple time frames, making it suitable for swing and position traders as well as day traders. Easily visualize important price levels where longs and shorts attempt their defense!
TradersPost simplifies automated trading across various asset classes. Automate your trades with ease, leveraging powerful tools and strategies designed for traders of all levels.
Fibonacci LevelsL Institutional Support and Resistance Levels by DTB Traders offer unparalleled accuracy for futures market trading. With automatic adjustments for new highs and lows, save hours on analysis across multiple instruments and time frames.
Elevate your trading strategy with the DR/iDR Indicator for NinjaTrader: Your essential tool for identifying key price levels. This advanced indicator displays both the Daily Range and the Implied Daily Range directly on your trading charts, providing crucial insights.
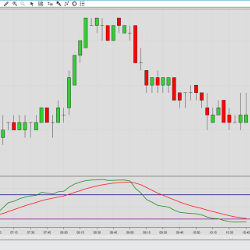
The Slow Relative Strength Index is an adaptation of the classic RSI calculation, customized for use in higher timeframes. The slow RSI calculation compares the close price with an exponential moving average instead of the previous value.
December 2, 2024
Mastering Sideways Markets With Auction Bars and Range Projections
November 19, 2024
Enhancing Your Automated Trading System: Key Insights from Best Pro Trade
November 14, 2024
NinjaTrader New Ecosystem Tools: October 2024 Edition
Enter Email for Updates