Suite of four complementary indicators provides entry and exit alerts while offering valuable price momentum insights. These indicators can be integrated with your preferred setups and present price momentum in a visually engaging, color-coded format.
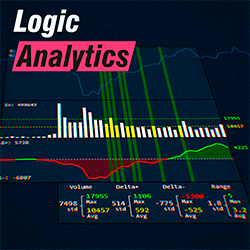
Visualize the relationship between delta and volume with accurate statistical calculations on delta, ask, bid, and volume. This tool combines the power of data analysis with advanced charting, allowing you to see the most relevant market movements.
Get educational swing trading ideas for the Micro Emini S&P 500 and Micro Emini Nasdaq futures. These are real-time swing trading ideas that are posted to a private Telegram group for all users to read. Dynamic risk and position management are also included.
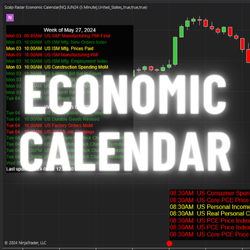
Stay ahead of market-moving events with this comprehensive news agenda, displaying upcoming events like CPI, PPI and Jobs data categorized by impact. Event marker are drawn directly on your chart with hover-over features. Filter by country, impact, or event name to optimize your trading strategy.
BookMap helps traders detect better support and resistance levels by plotting order book data directly on the chart. Through market depth behind price bars, order flow traders can watch the limit order book unfold in real time, highlighting significant price levels such as support and resistance.
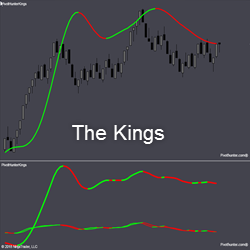
THE KINGS include King 1, 2, 3, and 3Kings. They measure order flow at 3 levels, then combine all three into one - The 3Kings. The bottom panel shows Kings 1, 2 & 3. The top panel shows them combined into The 3Kings. This provides traders with a very smooth indication of order flow.
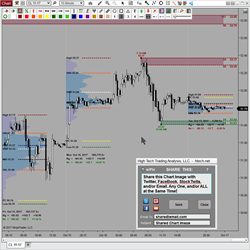
Chart Capture and Sharing provides a simple, easy, and convenient all-in-one solution for chart image capture and sharing! It is a one-click solution to automatically capture and save an image of your chart, and optionally share that image to email, Twitter, StockTwits, and/or Facebook.
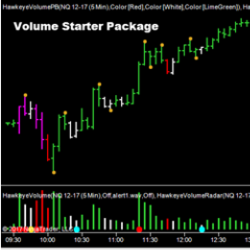
Hawkeye Starter Package is an immensely powerful leading indicator that performs over 300 calculations per bar to analyze the price action and associated volume, signaling price movement prior to it happening. Buy the Hawkeye Starter Package now at its affordable low price!
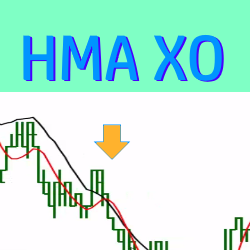
This trade setup indicator paints entry signals each time a Hull Moving Average (HMA) crossover occurs. The entry signals are customizable and can be filtered by the slope of the linear regression. Click here to watch a video and lean more!
Learn how Volume Profile works and use it to track big financial institutions who move and manipulate the markets. Learn my most favorite Volume Profile trading strategies. This book is written in poignant way with many illustrations and real trade examples.
December 2, 2024
Mastering Sideways Markets With Auction Bars and Range Projections
November 19, 2024
Enhancing Your Automated Trading System: Key Insights from Best Pro Trade
November 14, 2024
NinjaTrader New Ecosystem Tools: October 2024 Edition
Enter Email for Updates