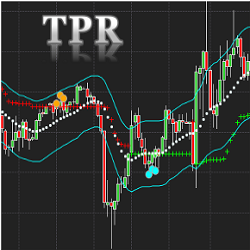
The Trend Pullback Reversal (TPR) Indicator displays possible price trends with pullback and reversal signals. TPR will focus on the main trend and filter out most minor price movements. The NinjaTrader 8 version comes with a unique band and center line as additional features.
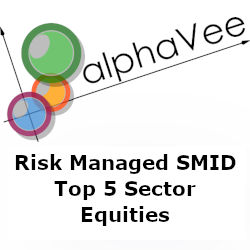
This model balances four separate risk lenses that seek to generate alpha while moderating standard deviation over multi-year periods. Each risk lens is independently applied based on Alpha Vee's breakthrough fundamental momentum research. Equities are from small/mid cap universes.
The Job Pivot is a volume profile analysis that allows the user to gauge a directional bias with price targets. It provides an equilibrium between buyers and sellers for the purpose of identifying control of the session’s auction.
This study guide covers most of chart patterns of the price action. The study will cover trendline strategies, candlesticks patterns, chart patterns, Elliot Wave Theory, harmonic patterns, risk management, trading plan and trading psychology.
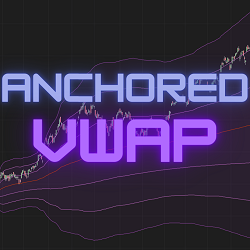
Enhance your trading with our point and click Anchored VWAP indicator for NinjaTrader 8. Built as an indicator, not a drawing tool. Features unique point-and-click anchor setting with hotkeys, 3 customizable deviation bands, and 8 VWAP calculation methods. Start your free trial today!
TrendLine Indicator plots red and blue lines to determine the trend. Easily detect the trend direction in any markets so you can easily find ideal trade setups. The red and blue arrows confirm the trend directions and plot above and below the candles.
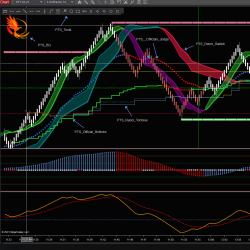
This four-part offering consists of an indicator package, a training program covering the use of indicators & fundamentals of trading mindset, a video library of online sessions, and membership in the Phoenix Traders Support Group. See website for 5% discount on first purchase.
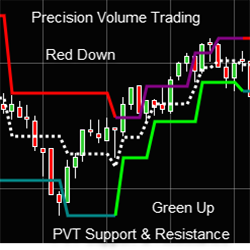
Precision Volume Trading Support & Resistance measures each swing point for traders to know where buyers and sellers are.
The VIP Membership at EminiMind is designed to help improve your trading consistency through weekly live trading sessions, a series of structured trading videos, and weekly trade recap and analysis that will walk you through all of the trading methods they use.
This masterclass on day trading the E-mini Futures is a two hour, in-depth, start to finish walkthrough of the Fib Retracement day trading strategy that EminiMind has used on the E-mini S&P for nearly 15 years. It can also be used on the micros and Forex.
December 2, 2024
Mastering Sideways Markets With Auction Bars and Range Projections
November 19, 2024
Enhancing Your Automated Trading System: Key Insights from Best Pro Trade
November 14, 2024
NinjaTrader New Ecosystem Tools: October 2024 Edition
Enter Email for Updates