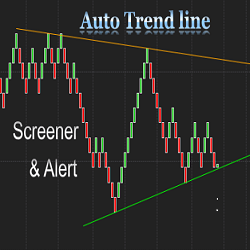
The Auto Trend Line Alert indicator will automatically plot the upper and lower trend lines based on the most recent swing points. It works on all timeframes. The NinjaTrader Market Analyzer makes it possible to track price action related to trend lines in any timeframe.
Die TrendTechnik® ist ein neuer eigenständiger und in sich geschlossener Fachbereich. Mit trendtechnischen Methoden werden Tradern sowie Analysten besondere Situationen sichtbar und nutzbar, die vielen Anderen verborgen bleiben. Erfahre mehr und nutze die deutlich besseren Möglichkeiten und Chancen.
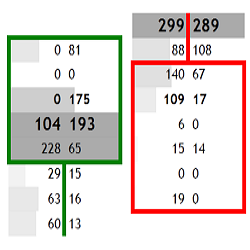
Volume Ladder allows traders to display bar intrinsic, tick level volume and bid-ask information in neat and clean format. Various visual customizations are available to suit a variety of uses. This is an essential tool for order flow analysis, and market/volume profile structure traders.
Unlock your trading potential through Factor-Model Implementation & Quantitative Trading with Python! Master factor-based strategies for quantitative trading. Learn essential Python for financial markets, swiftly implement your ideas, and elevate your trading. Enroll now for a competitive edge!
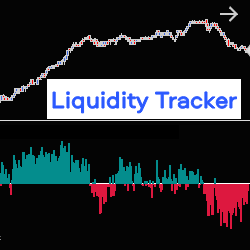
The Liquidity Tracker allows you to monitor, in real time, liquidity variations in the Order Book (pending orders at Bid & Ask), on one or two correlated instruments, at the same time. It therefore allows you to follow the evolution of the market based on the strength of supply or demand.
Are you busy but want to be consistent in the market? Do you want a strategy with fixed rules? Here, you get an automatic robot including an indicator and complete strategy, plus access to an internal Discord channel. Get started with a one-week free trial today over zoom, no installation needed!
The ST Inside Bars visually displays when a time-based bar forms inside a previous bar, also known as a Mother Bar. Learn more about ST Inside Bars today!
The SuperDOM Average Price Column shows a position average price accumulated since the first order execution. All opened and closed executions from the beginning of the position are used for the calculation. Save time by knowing your current position's average price for all of your past entries!
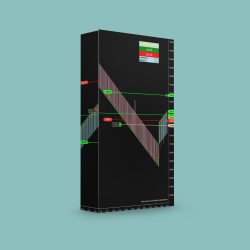
SniperTrader is a fully automated trading system that can reduce or completely remove the stress of day-to-day trading. It helps advanced or beginner traders with an easy plug-and-play function to set up and operate.
Unable to find your best strategy? Automation? Click here for a free 30-minute call. SET UP helps you to build your automated strategy in order to improve it on own. Book your free appointment now.
December 2, 2024
Mastering Sideways Markets With Auction Bars and Range Projections
November 19, 2024
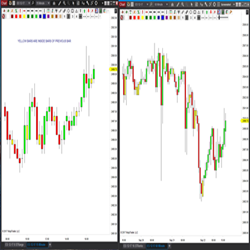
Enhancing Your Automated Trading System: Key Insights from Best Pro Trade
November 14, 2024
NinjaTrader New Ecosystem Tools: October 2024 Edition
Enter Email for Updates