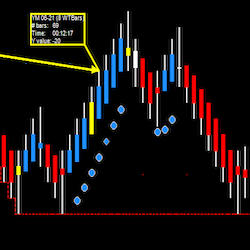
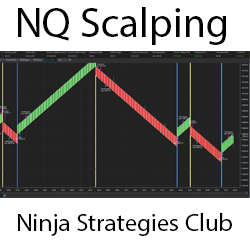
Day trading E-Mini futures system focused on trading the RTY, NQ, YM, ES and FDAX futures. Combines a proprietary chart, indicators and trade plans, along with a live training room every market session. Completed in thirty minutes or less on most days.
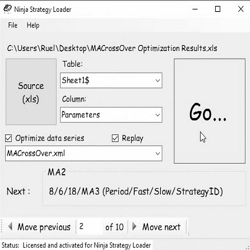
The Ninja Strategy loader allows traders to quickly and accurately load strategies into the NinjaTrader Strategy Tab or Chart Windows. Learn more!
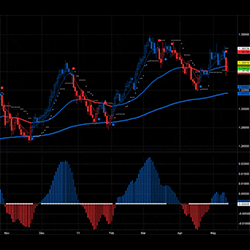
Our Swing Trading software is based on price, support & resistance. It has undergone over 1000 hours of machine learning to build its algorithm. We send out algorithm updates regularly to keep the system performing. It is built and tuned for swing trading.
Easy Trader is a complete trading system and offers many options. The display is easy to read and use. When a signal fires, an arrow is plotted and can be used with our ATM Entry Assistant. Easy Trader is our oldest product, has been in use over the past twenty years, and it still works.
The Linear Regression Channel (LRC) is designed to truly detect when prices are overbought or oversold. Different than other LRC indicators, the width of the Stealth Traders LRC channel is based on a proprietary formula, designed to pinpoint opportune entry and exit signals. Upgrade Your LRC Today!
Open-source code can be developed. If you want, you can add different strategies on it. Lifetime free updates. Take-profit at three, five or seven ticks, stop-loss at 13 ticks. Change the take-profit and stop-loss settings.
See trade setups develop in real time in the Easy E-mini Trade Chat Room! Open Monday – Thursday 9:15 – 12:00 ET, sign up for your 3-day trial today!
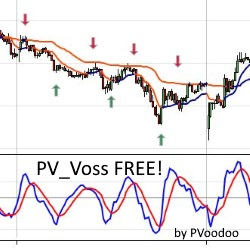
Try this FREE Voss Predictive Filter by John Ehlers & Henning U. Voss, with source code included by PVoodoo.com. Test it today for free!
This is the ultimate mean Renko version (with wicks) for NinjaTrader 8. It removes noise and helps visualize trends. ninZaRenko can be used for charting, trading, backtesting, and programming. It is trusted and loved by thousands of traders worldwide. Download free now!
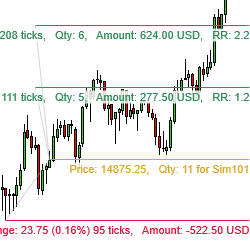
Calculate your position size automatically by drawing a stop loss and entry and target levels on your charts – and, optionally, submit the associated orders. When the instrument currency is different than the account currency, it automatically calculates all amounts in the account currency.
December 2, 2024
Mastering Sideways Markets With Auction Bars and Range Projections
November 19, 2024
Enhancing Your Automated Trading System: Key Insights from Best Pro Trade
November 14, 2024
NinjaTrader New Ecosystem Tools: October 2024 Edition
Enter Email for Updates