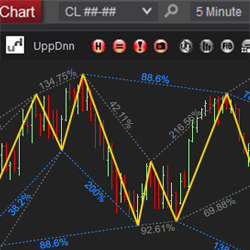
Complete your NT Fibonacci Toolbox with a designated Fibonacci Fan. Effortlessly forward plot support & resistance, trendlines, speedlines & confluence checks with traditional Fibonacci retracement analysis at 23.6%, 38.2%, 61.8%, 76.4% & 86.6% (+50%). Custom create other watch levels if required.
The Swing Toolkit is a collection of swing analysis tools designed to make trading faster and more consistent. Swing Pattern Trading utilizes the recognition of specific price patterns and the alignment of exact Fibonacci ratios to determine possible reversal points in the financial markets.
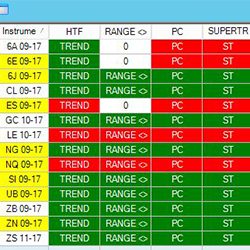
The JATS Market Analyzer Template for the NinjaTrader 8 platform has customized blackbox BloodHound solvers that show when momentum, linear regression and trend are in synchronization across multiple time frames.
Copy your trading from full futures (e.g., ES, FDAX to Mini or Micro Future [MES, FDXS/M]) to live accounts. Smart and easy-to-use. Combine the analysis from full futures with the risk management possible with mini or micro futures. Get started today with a two-week free trial!
Let us help you automate your indicator or strategy! Our custom programming service provides automation for indicators and automated strategies.
Enhanced Decision-Making; Trading Awareness/Behavior. Basic Training accelerates improvement by strengthening behaviors causing the brain to filter, process, and apply information most effectively. Psychology, sociology and neuroscience are integrated to keep decisions ahead of price movement.
Forecast oncoming trading patterns! Trade Forecaster tells you what price action to expect, allowing you to properly prepare your strategy in advance. It will alert you to oncoming scalp, swing or trend trading conditions. See a video of Trade Forecaster in action!
Enhance your trading strategy by visually delineating the Asia and London trading sessions on your charts. This powerful tool highlights the start and end times of these sessions, marks the high and low points, and extends these levels until the end of the New York regular trading session.
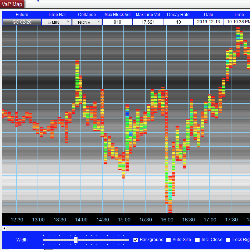
Visualize the market like never before. The VAPMap (Volume At Price Map) displays the total volume traded at each price and time, using a color spectrum from red (lowest) to blue (highest). The background lines show the total historical traded volume for every price level. Click for a free trial.
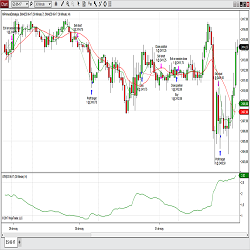
This is a UNIVERSAL solution to regular divergence trading. Divergences can be identified by comparing price action and an oscillator of your choice. Yes, you can freely use this NinjaTrader divergence indicator with RSI or MACD, stochastic, CCI, and other indicators, from any vendors!
December 2, 2024
Mastering Sideways Markets With Auction Bars and Range Projections
November 19, 2024
Enhancing Your Automated Trading System: Key Insights from Best Pro Trade
November 14, 2024
NinjaTrader New Ecosystem Tools: October 2024 Edition
Enter Email for Updates