Save money by purchasing the Ultimate Account Management Bundle for NinjaTrader! This all-in-one solution combines their premiere Duplicate Account Actions trade copier and their top-rated Account Risk Manager at a better price!
Our intelligent and powerful automated strategies let you rule the markets like a pro. Algos are available for most popular futures markets and are ready to go out of the box. Our strategies are NinjaTrader 7 & NinjaTrader 8 compatible to take your trading to the next level.
The EminiScalp Stalker is an automated strategy that is designed to assist traders with the ever-difficult emotion of entering and staying with a trade. The Stalker searches for potential scalping and trend entries throughout the trading session.
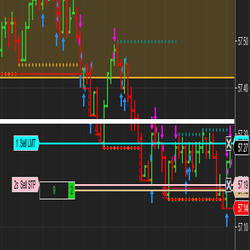
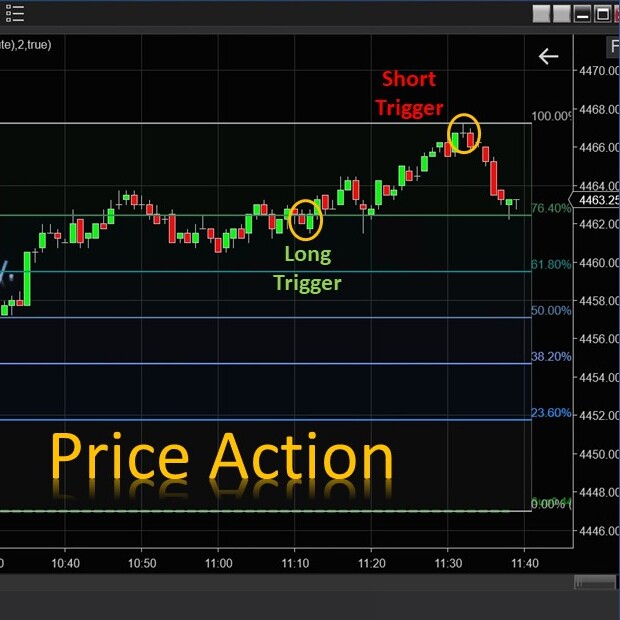
The E.G. Price Action is automatically integrated with the E.G. Trigger Point presented on your chart to generate short and long signals for you. It recognizes Price Action opportunities and generates arrows presented on your chart and sound notifications.
DTB River is an implementation of DTB Waves on non-time based charts and the results are plotted on time-based charts. It provides an added layer of noise filtering for waves. During the consolidation phase DTB River flattens out.
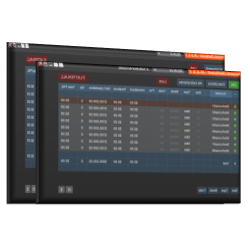
Market Analyzer Column: Effortlessly tailor real-time market data to your needs.
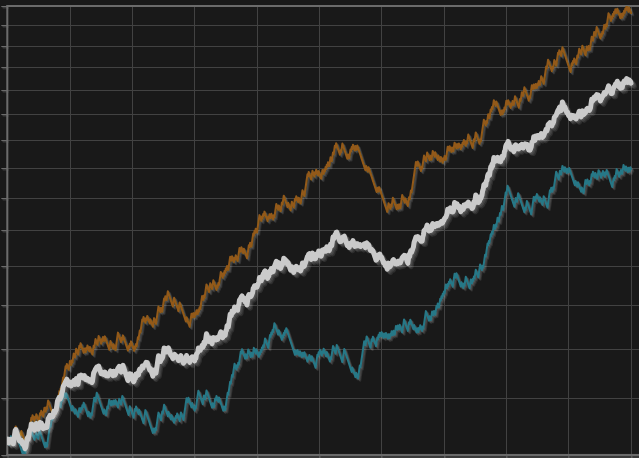
This is a trend following trading system trading simultaneously on three configurable and back testable time frames. It is aimed to be used as a CTA, trend following, multi assets trading system where the tradable assets universe is composed by futures on indices, commodities and foreign exchanges.
A cutting-edge indicator designed to make order flow trading both effective and enjoyable. Featuring an intuitive footprint chart, it provides valuable insights into historical and real-time market activity. The footprint chart reveals buy and sell volumes and order flow within each price bar.
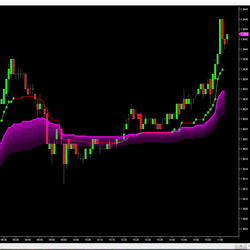
The ribbon-like indicator, Fantastic MA Ribbon, is created by plotting multiple moving averages (MA) with varying lengths. It incorporates four signal mechanisms, offering diverse options to align with your unique trading style.
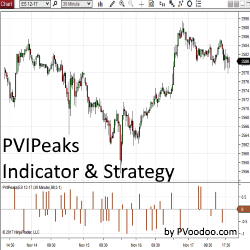
PVIPeaks Indicator and Strategy pinpoints peaks from any standard NinjaTrader indicator and allows traders to use them to generate a signal for an automated strategy. This tool is available exclusively for NinjaTrader 8. Get your free trial today!
December 2, 2024
Mastering Sideways Markets With Auction Bars and Range Projections
November 19, 2024
Enhancing Your Automated Trading System: Key Insights from Best Pro Trade
November 14, 2024
NinjaTrader New Ecosystem Tools: October 2024 Edition
Enter Email for Updates