Have you ever tried to figure out where to place your profit target to hit your profit goal for the day? Or where to place your stop-loss to avoid max drawdown? Calculate and move your orders in a single click with Quick Trade. Includes commissions and realized P&L.
At ProlongWealth Trading, they offer a gateway to the Futures Prop Firm industry through tailored recommendations, exclusive discounts, and comprehensive YouTube education.
Introducing Core Buttons, the ultimate trading tool for split second decision making. These intuitive buttons provide instant access to essential trading functions, enabling you to execute trades, manage positions & adjust orders with a single click. Tailor the customizable options to your trading.
The LogikRenkoStreamline is an improved variant of the traditional Renko Bar type. By granting the ability to set the Reversal Brick size, the bar type will minimize spurious reversal whipsaws.
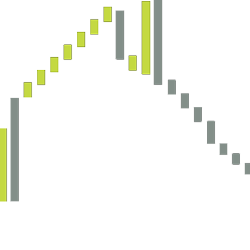
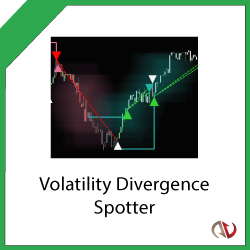
Spot the calm before the storm for both breakouts and breakdowns with this ultimate volatility indicator! Spot bullish accumulation and consolidation points before strong upward breakouts and continued bullish trends. Find points of failing strength at plateaus and tops before drops.
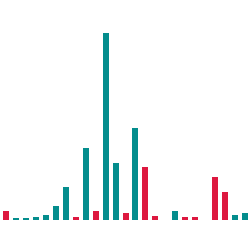
The MPace indicator shows the Velocity (speed) of the tape. It allows users to see the speed at which bids are being hit, and the speed at which offers are being lifted.
Quick Trade Ninja - Break Even Plus is designed to allow you to quickly move your ATM strategy stop loss to Break Even plus or minus a certain number of offset ticks. Quick Trade Ninja Break Even Plus quick action can be configured as a chart trader button, a hotkey or both.
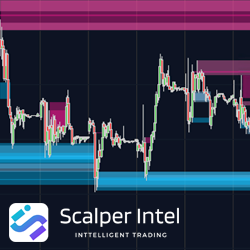
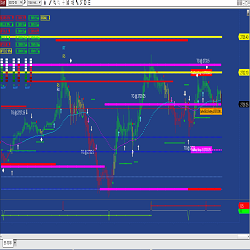
Elevate your trading strategy with the Volume Levels Indicator. Detecting support and resistance from volume, it delivers precise levels respected by the price. Features include order flow cumulative delta integration, real-time order block detection, an age counter for significance tracking & more.
Our automated trading system features scalping, swing trading, automatic entry & exit signals and price action-based trading. With no optimization required, the Best Pro trade systems are based on statistical analysis and algorithms based on advanced mathematical computations.
Side-Bias Indicators include intelligent moving averages and a trailing stop indicator for NinjaTrader. Included are 3 proprietary calculations that track price very accurately yet smoothly, offering stunning support and resistance levels. They pick a side to stick to price while avoiding whipsaws.
December 2, 2024
Mastering Sideways Markets With Auction Bars and Range Projections
November 19, 2024
Enhancing Your Automated Trading System: Key Insights from Best Pro Trade
November 14, 2024
NinjaTrader New Ecosystem Tools: October 2024 Edition
Enter Email for Updates