Master the market with this intelligent trailing indicator! Smart volume-based trailing algorithm identifies up and down trends. Perfectly suited to support “stop-and-reverse” as well as “always-in-the-market” trading styles. Discover the most consistent symbols with an instant performance graph!
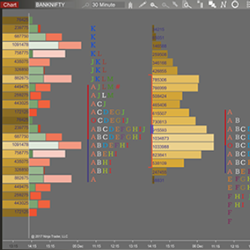
Bell Market Profile aims to help traders visualize what is actually happening in the market by displaying where trades are occurring. It features split vs composite profile, high volume alerts, absolute volume profile all with customizable colors.
This system will take you through the process of how to "risk 1 to make 2" that professional traders utilize to increase their profitability and have consistent months, quarters and years. The system incorporates philosophies found in "Trading in the Zone" by Mark Douglas.
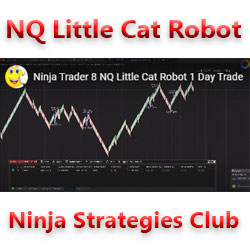
A slow but efficient robot for NinjaTrader 8. It only works on NASDAQ. Take-profit at 13 ticks; stop-loss at 18 ticks. If you want, you can change the take-profit and stop-loss settings.
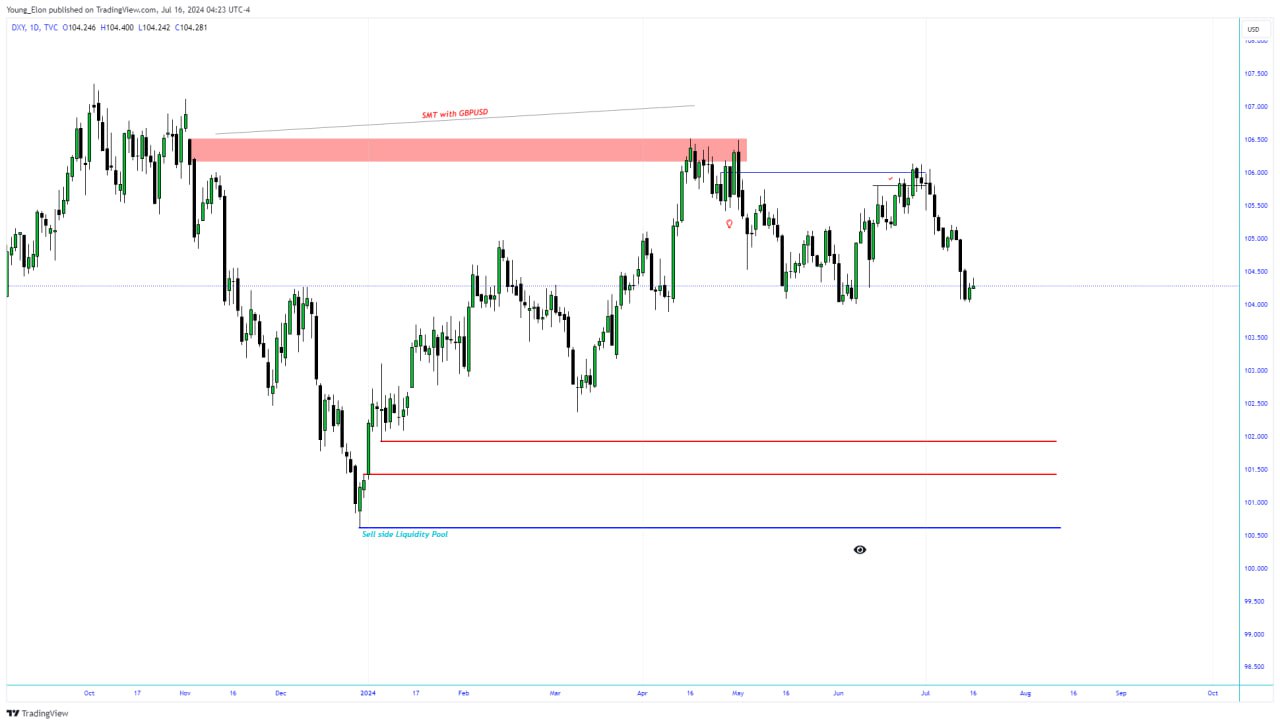
This is a YouTube channel, in which they share the precise models for smart money trading concepts. With the concepts, you can trade like the banks, by following their foot prints. With the models, you are able to see the specific footprints and in return trade like the institutions.
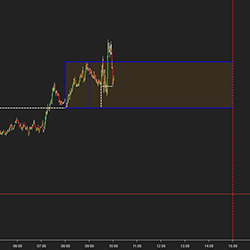
Add the visual benefit of displaying the session open value (settable). Build a visual range of any timeframe you choose. For example, the first 30 minutes of the market open or an hour before the market opens. Choose the end time for a range to stop displaying for the day.
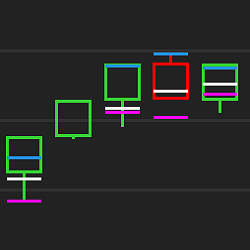
Are you using Renko/range/tick/volume bars? Optimal Tempo shows you the high/low/close of time-period bars overlaid on your chart. Choose any time period you wish. See five-minute bar levels overlaid on a Renko chart! No need to watch other charts. Strategy compatible.
edgeful breaks down market data into easy to read reports that instantly show you how any asset behaves, down to a specific weekday. They have all the breakdowns to tell traders when to size into a trade, when to size down, and even where to set your profit targets, based on the data, not opinions."
The Volatility Index (VIX) is a real-time market index that represents the market's expectation of 30-day forward-looking volatility. The VIX moves inversely to the indices and is often used as an indicator of upcoming market moves to time precise entries and exits. AKA Fear Gauge or Fear Index
tickmatrix is a small team of disciplined and dedicated programmers who architect intermarket trading strategies, indicators, API and more.
December 2, 2024
Mastering Sideways Markets With Auction Bars and Range Projections
November 19, 2024
Enhancing Your Automated Trading System: Key Insights from Best Pro Trade
November 14, 2024
NinjaTrader New Ecosystem Tools: October 2024 Edition
Enter Email for Updates