Trade your own capital with consistency. Follow your own plan from day one. Develop and demonstrate your trading skills. Pass qualification to get a Master Account. Show results and get your first $10k withdrawal commission-free. Invest in yourself. It's time to catch a wave!
A cutting-edge indicator designed to make order flow trading both effective and enjoyable. Featuring an intuitive footprint chart, it provides valuable insights into historical and real-time market activity. The footprint chart reveals buy and sell volumes and order flow within each price bar.
Choose from an assortment of indicators with enhancements not found anywhere else. (Digital Clock, Bar Timer, Divergence, Price Channel, Current Bar Range). Get free trials of these unique indicators now!
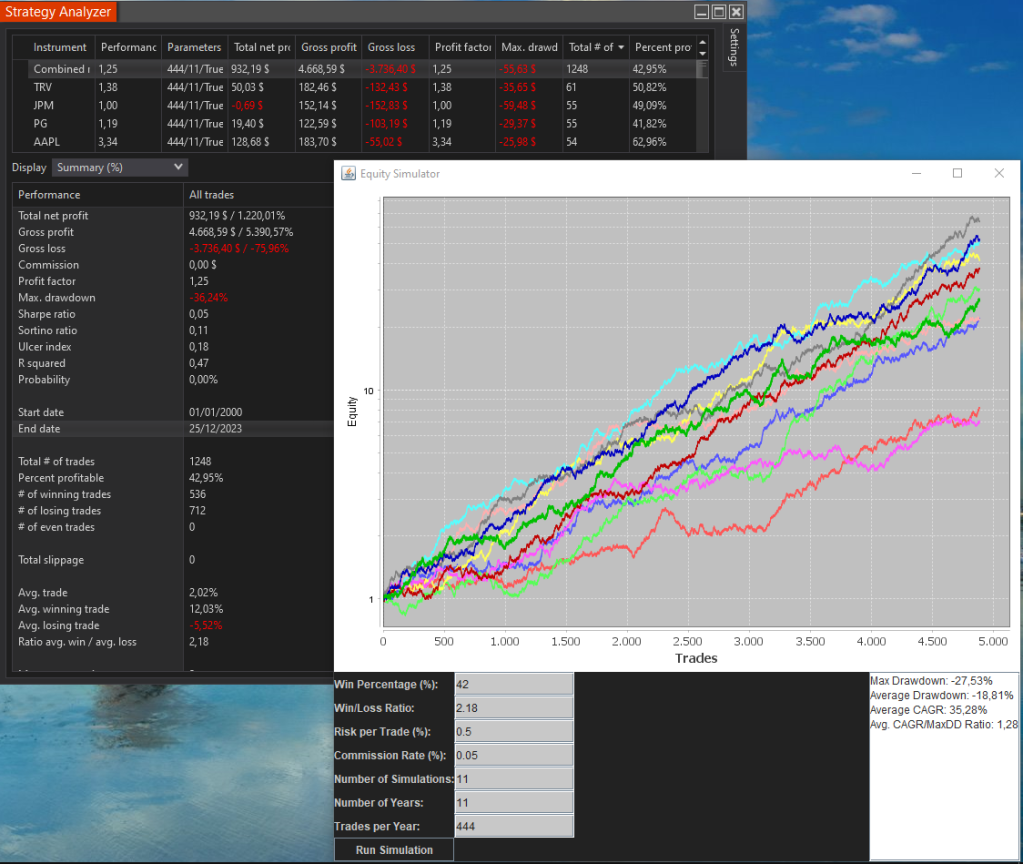
We can take the parameters from the Strategy Analyzer summary and generate a forecast for the desired numbers of trades and years. We can estimate our optimal risk per trade.
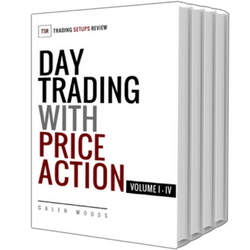
Trend lines, swing pivots, and price patterns are simple price action trading tools that seasoned traders use daily. Day Trading With Price Action, by Galen Woods, is a high-quality trading course that teaches how to effectively trade via price action analysis. Download a free chapter today!
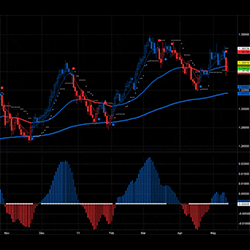
Our Swing Trading software is based on price, support & resistance. It has undergone over 1000 hours of machine learning to build its algorithm. We send out algorithm updates regularly to keep the system performing. It is built and tuned for swing trading.
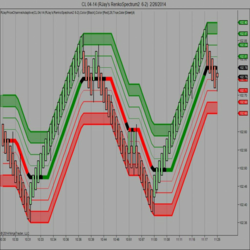
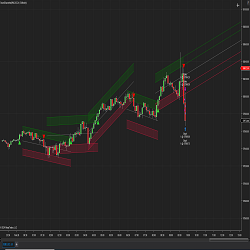
Channel levels are defined based on high and low prices influenced by candlestick bodies. These points are calculated based on the defined channel levels and look back periods. Delta values are computed to determine the channel's upward or downward slope.
Free Room includes sessions to learn trading tips, watch live markets, and news releases. There are evening and early morning special sessions to prepare for the day, and week ahead. See live market setups and learn how to manage risk and trades.
PoshTrader is a fintech company based in Estonia that specializes in custom development and out-of-box solutions for traders. We convert, retain and increase the lifetime value of trading platforms. Our work focuses on enhancing the trader's experience and performance.
Chompsky Bands: Single and second entry reversal signals and momentum signals, including MACD V5 signals. Includes min/max Bars Per Minute (BPM) filter, Trend Resilience, EMA Tick Separation Filter, Wave Counter. Signal outputs and customizable tags.
December 2, 2024
Mastering Sideways Markets With Auction Bars and Range Projections
November 19, 2024
Enhancing Your Automated Trading System: Key Insights from Best Pro Trade
November 14, 2024
NinjaTrader New Ecosystem Tools: October 2024 Edition
Enter Email for Updates