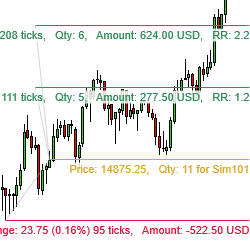
Calculate your position size automatically by drawing a stop loss and entry and target levels on your charts – and, optionally, submit the associated orders. When the instrument currency is different than the account currency, it automatically calculates all amounts in the account currency.
This trading plan is applicable to futures, stocks, Forex, crypto or any financial instrument. This course will help you to understand a trading model based on price action and risk management. It is an evergreen methodology based on the law of supply and demand.
This strategy uses a collection of moving average and oscillator indicators to identify trends in the market. The use of limit orders for entry and exit orders get's you the best price possible when buying or selling. This strategy uses both long trades and short trades.
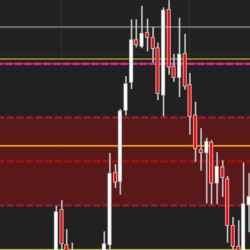
This is a UNIVERSAL solution to regular divergence trading. Divergences can be identified by comparing price action and an oscillator of your choice. Yes, you can freely use this NinjaTrader divergence indicator with RSI or MACD, stochastic, CCI, and other indicators, from any vendors!
Several studies have found a connection between full and new moons and stock market performance. Knowing how and when to time the cycles in trend shifts is centuries old, but new to most traders.
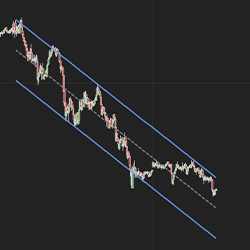
Trend channels are one of the most respected trading strategies used in the markets. However, they can sometimes be tricky to draw, and it's difficult to know if your lines are accurate. Tyche Trading’s unique Price Action Trend Channel Indicator makes it easy! Get a seven-day free trial today!
The “opening range” is the range obtained from the highest and lowest price of a security during the first minutes of daily trading activity. The JATS Opening Range Indicator displays the OR and the current open of the RTH session for a defined time period, as well as the pre-session Globex.
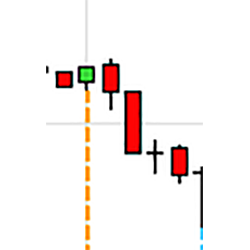
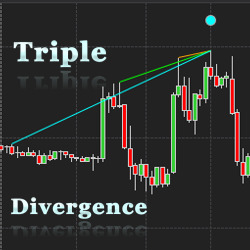
When three continuous divergences occur the WilliamsR Triple Divergence Indicator will trigger an entry signal at the current bar. This indicator integrates with NinjaTrader’s market analyzer and indicates either bullish or bearish divergence at x number of bars ago.
Technical indicator for discretionary trading. It suggests stop-loss and take-profit levels for your entries, considering volatility. It also serves as a trend filter and guide for trailing stop and trailing take-profit. It doesn’t clutter the chart and is adaptable to your strategies and style.
Prove you have what it takes to make money and we may fund you as a trader! We did it ourselves, we’ve done it for others, and we know we can help you, too. Learn. Get Funded. Trade! Come take the TradeDay Evaluation Challenge and get funded as a trader with our capital in live markets.
December 2, 2024
Mastering Sideways Markets With Auction Bars and Range Projections
November 19, 2024
Enhancing Your Automated Trading System: Key Insights from Best Pro Trade
November 14, 2024
NinjaTrader New Ecosystem Tools: October 2024 Edition
Enter Email for Updates