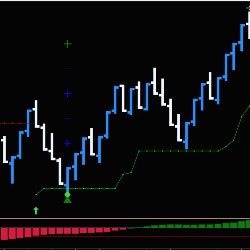
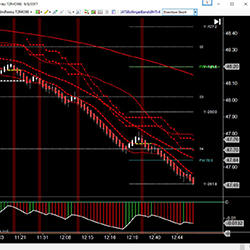
The ATS_TrendRider indicator toolset plots trend reversals and trend extensions. Fully customizable for your trading preference, each identified trade plots the entry, stop loss, and profit targets based upon current ATR.
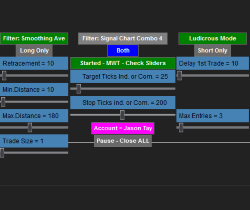
Maximize trading with Modena Wick Trader, offering total control, dynamic market adaptation and custom settings for optimal efficiency. Automation to the next level!
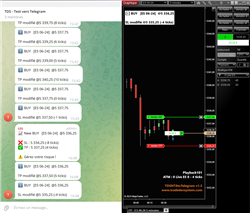
This indicator will be responsible for sending on your telegram channel your positions taken using ATM.
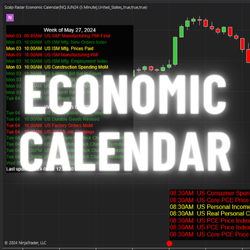
Stay ahead of market-moving events with this comprehensive news agenda, displaying upcoming events like CPI, PPI and Jobs data categorized by impact. Event marker are drawn directly on your chart with hover-over features. Filter by country, impact, or event name to optimize your trading strategy.
The JATS™ Complete Package* includes the JATSLRTLines™ Indicator for NT8 as well as a comprehensive set of Black Box Shark Indicators BloodHound Templates customized for NinjaTrader Charts and the Market Analyzer.
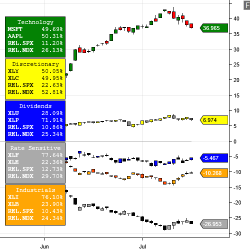
SectorJunky builds MarketCap Weighted Indexes from stock symbols with no math required. All indexes are perfectly weighted. You can also build Custom Weighted Indexes.
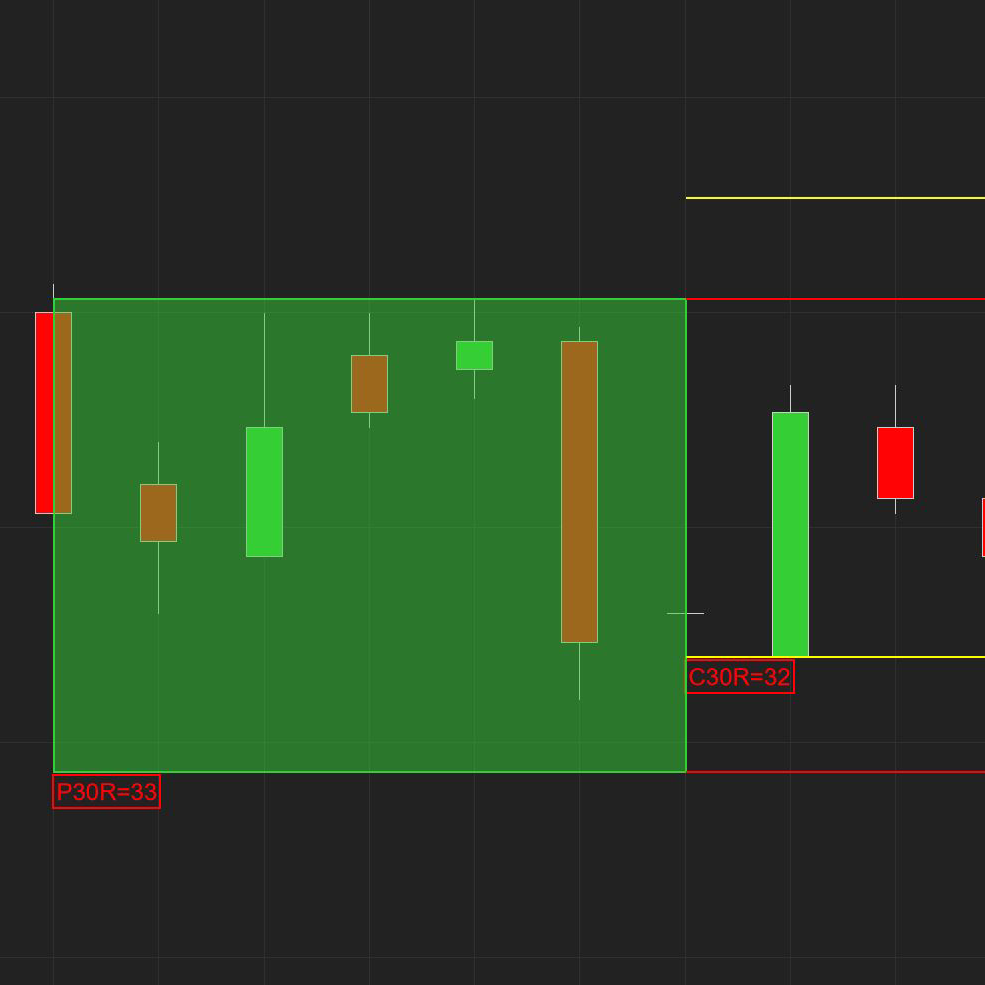
The purpose of the Free 30-Minute Range Indicator is to display visually the Previous 30-Minute Period and the Current 30-Minute Period's relationship to the previous period.
Elevate your trading to new heights with the platinum plan package. This comprehensive package includes all 9 NinjaTrader indicator modules and 13 NinjaTrader Drawing Tool modules from the gold plan, providing a solid foundation for market analysis and charting.
A simple and versatile automated system based on one strategy. The strategy includes a technical management module, indicators, color backgrounds and a comprehensive money management module. All leases include training and support!
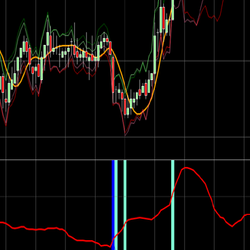
This indicator is extremely versatile and can be used in several time frame charts and even bar charts including range, tick or volume. It works best for instruments like NQ, ES or YM over tick charts. See the real price movement and identify the spikes in the curve plot.
December 2, 2024
Mastering Sideways Markets With Auction Bars and Range Projections
November 19, 2024
Enhancing Your Automated Trading System: Key Insights from Best Pro Trade
November 14, 2024
NinjaTrader New Ecosystem Tools: October 2024 Edition
Enter Email for Updates