The Builder Blocks NinjaTrader courses will provide a good foundation in NinjaScript programming. Learn to create your own indicators and automated strategies. Recorded lessons permit you to work at your own pace. Let us help you start your NinjaScript programming.
Trading123 AutoTrader is a fully automated trading algorithm that has been programmed to identify the trend. It includes entries, exits, profit targets, trailing stops plus profit & stop loss management. Designed to trade the futures markets, trend reversals and remove human emotion from trading.
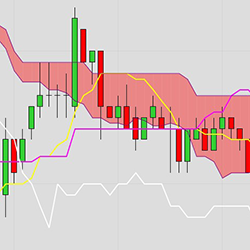
Free Ichimoku Cloud Indicator for NinjaTrader 8! This indicator can be used for both discretionary trading or as part of a NinjaScript based strategy. Download it today!
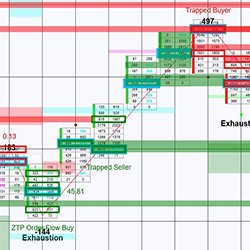
The ZoneTraderPro Order Flow Pattern Indicator identifies 7 different patterns, including tops and bottoms in a market using the Point of Control, trapped traders, ratios, historical support and resistance, and the exclusive ZTP Order Flow. Learn when to buy and sell based on order flow!
The LogikDeltaRenko is a unique Cumulative Delta based bartype with Renko like trend and reversal attributes. It fuses market price with buyer vs seller volume, granting maximum ability to maintain the underlying market sentiment while minimizing volume based reversal lag.
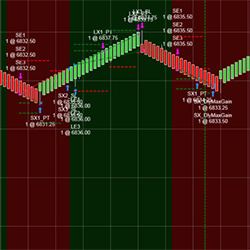
Professional-grade, lightning-fast trading system that self-adjusts to the current volatility conditions as it trades the re-emergence of momentum on modern financial markets. Available in standalone and Bloodhound versions. Built rock-solid for NT8.
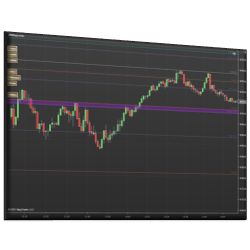
The Key Levels Confluence Indicator calculates various daily levels and combines them into powerful zones where price action is likely to respond in the future. Daily levels include the Open, High, Low and Close (OHLC) of past days, Fibonacci Levels, Whole Numbers, Current Day Levels and Pivots.
Providing a monthly service to this trading algorithm, SpartanBot. It is a trading algorithm that focuses on momentum trading, and follows a good risk management.
This Order Flow indicator package takes the information overload out of interpreting complex footprint charts and volume data by doing the calculations internally, and then plotting easy to read objects on the chart. Your membership includes the software, one month trade room access and mentorship.
A comprehensive indicator suite for order flow and volume analysis. MarketProfile charts show the bigger picture, BookFlow visually displays the real time and historical order book and Footprint charts reveal the aggressive side of the market. Trade room access and a 14-day free trial are included.
December 2, 2024
Mastering Sideways Markets With Auction Bars and Range Projections
November 19, 2024
Enhancing Your Automated Trading System: Key Insights from Best Pro Trade
November 14, 2024
NinjaTrader New Ecosystem Tools: October 2024 Edition
Enter Email for Updates