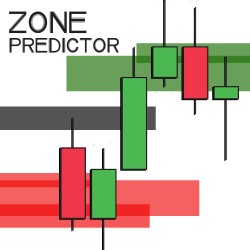
This "MATT" (Managed Algorithmic Technical Trading) strategy looks at the recent price action and adapts to the market to produce a potential trading "Zone". It is fully automated when placing an entry, target and stop. There are override buttons should the trader wish to make adjustments.
What a lovely day yesterday was! Do you ever wonder if there were similar days in the history of a trading instrument, and what happened thereafter? With the Similar Days Project, view price scenarios for 24 different currency pairs. This technology is scalable on any market.
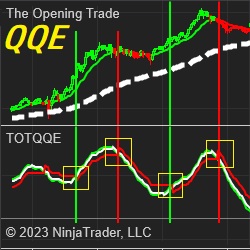
This is the indicator used in the QQE Swing system. This indicator is a version of the popular RSI that, in theory, uses moving averages to smooth the RSI and price. Like any other indicator, this should be paired with additional indicators. It is coded to be used with the strategy builder.
Receive live entry/exit alerts along with trade ideas and technical analysis for futures, stocks and option trading. Get market research, real-time alerts and more!
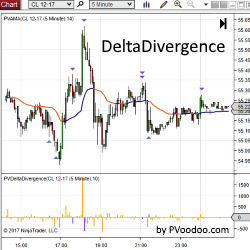
PVDeltaDivergence Indicator is a powerful tool designed to help traders identify possible turning points in their favorite markets with order flow analysis. Get a free trial of PVDeltaDivergence for NinjaTrader today!
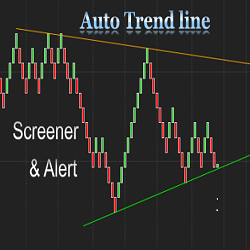
The Auto Trend Line Alert indicator will automatically plot the upper and lower trend lines based on the most recent swing points. It works on all timeframes. The NinjaTrader Market Analyzer makes it possible to track price action related to trend lines in any timeframe.
QWLoL is a new concept indicator – “LoL” stands for Limit of Length. That is what we are looking for in situations where the market is moving sideways but there is trending inside the curve. The challenge is to identify the length of the curve & estimate with consistency whether the price rebounds.
The Q-Indicator provides visual signals of overbought or oversold conditions in the market. Users can enter trades manually or use the indicator in an automated system to take advantage of the various market imbalances.
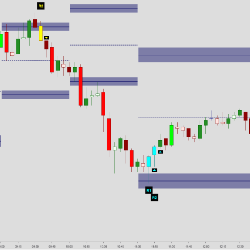
The Auction Bars indicator identifies higher time-frame ranges, displayed as Auction Ranges. These ranges show the current market value area of the ongoing auction. The accompanying congestion zones work as support / resistance where spike and reversal patterns frequently plot.
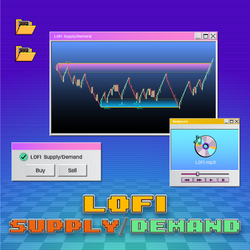
LOFI supply/demand goes beyond zone identification, delivering trading signals. It offers three distinctive signals within each zone: Pullback, return, and break signals. The indicator's well-defined rules ensure only the highest-opportunity signals are revealed, maintaining a clear chart.
March 25, 2024
Trading Pullbacks and Reversals: Simplifying a Once Complex Retail Trading Strategy
March 21, 2024
VWAP Indicator: Average Price Shown Based on Price, Volume
March 18, 2024
Trade Copier Strategies: Make Efficiency Work for You When Futures Trading
Enter Email for Updates