Your mindset can make or break your trading account. It's your mindset that determines whether you execute your trading plan or break your rules. Go Deep to Level Up Your Trading™ is the most comprehensive trading psychology course on the market. Join now.
Trading Mentor is an automatic system based on data science which helps traders understand the most important insights of their trading and adjust their trading strategies for consistent results.
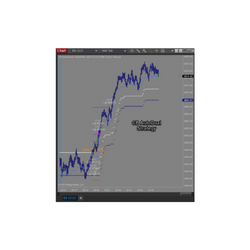
This strategy is fully automatic with many inputs for backtesting. In today’s volatile market, it is not a standalone system. It was created to give the trader real, automated insights regarding money management, max trades per day, trailing stops, profit targets, etc. Now you can know.
Trade with the best conditions in order to become an extraordinary trader, follow the risk management rules and reach your target in as little as 10 days. Once you have completed the target, we will connect you with one of our funding partners.
Toni Hansen is uniquely positioned to share over two decade’s worth of trading secrets, methodologies and financial strategies with clients in this highly interactive and market-focused learning environment.
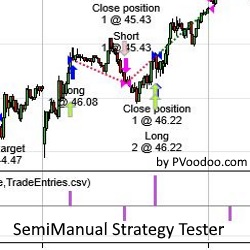
Do you have an idea which you would like to test without actually writing the strategy code to get the trading results? A simple way to do that is by using the PVAddManualTrades and PVUseManualTrades strategies, both utilizing statistics and options from the Strategy Analyzer. Try them free!
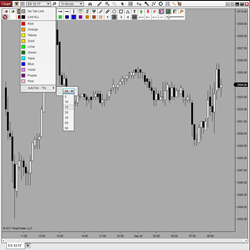
Auto Tab adds a Tab Link Selector to the top left portion of every Dom & Chart window. Simply click on the tab of any window, and all other windows (linked by color) will also change to that same tab! Simulate multiple workspaces with tabs and enable automatic sequencing with a configurable timer.
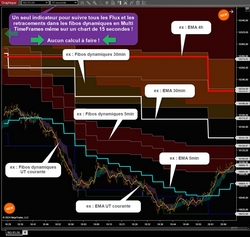
This indicator will calculate for you in multi timeframe: 4 EMA MTF + 4 “SunjoKu” MTF, the famous indicator invented by Joël Mathieu the boss of Intrad. Since version 1.5: A summary table of the status of the different TimeFrames has been included.
LizardIndicators offers custom NinjaScript programming for indicators, strategies and a wide range of trading tools. The custom programing service also includes the modification of existing scripts. Contact LizardTrader today for a quote or consulting session today!
The Quantum Dynamic Volatility indicator paints volatility as price action unfolds - no more guesswork, no more nasty shocks. Watch and wait, then trade with this safety-first indicator!
December 2, 2024
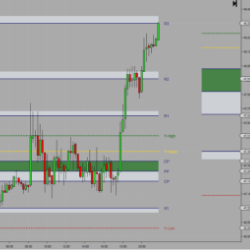
Mastering Sideways Markets With Auction Bars and Range Projections
November 19, 2024
Enhancing Your Automated Trading System: Key Insights from Best Pro Trade
November 14, 2024
NinjaTrader New Ecosystem Tools: October 2024 Edition
Enter Email for Updates