The Volatility Bands indicator attempts to present a way to measure and visualize volatility, using standard deviations (σ) and average true range indicator, and aims to point out areas that might indicate potential trading opportunities. Click to learn more.
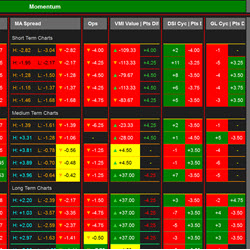
Market Pulse delivers extensive insights into market momentum and reversals across 15 time frames on a single screen, utilizing innovative modern indicators and chart patterns.
ElliottWaveTrader offers a live Trading Room of market analysis, based on Elliott Wave principle. Founded in 2011, the site benefits traders looking to anticipate the direction of U.S. & world equity indices, stocks, bonds, metals, energy & more over a time horizon of several days to several months.
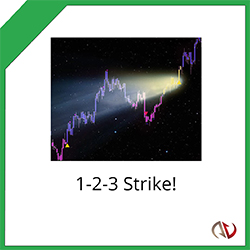
This intelligent indicator uses three different metrics to confirm trend strength so that you can plan your trades with greater confidence. It pinpoints precise moments to enter trades. 1-2-3 Strike! has innovative features like smart signals, performance statistics and attractive visuals.
Latency protection is built in to protect you during fast moves. Trend following technologically advanced product with a complex algorithm that adjusts stop distance. SAR type operation. Not to be confused with other SARs that don't change trend until the bar closes. This does it in real time.
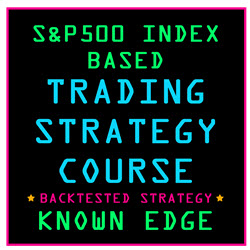
Learn how to build a backtested trading strategy with a known edge using the strategy development lifecycle process. You will be taking an Idea to an actionable trade plan! Start trading live with a tested strategy that can be adapted to futures, ETFs and options of S&P 500 and Nasdaq 100 Indices.
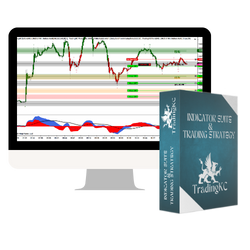
Simplify your trading with my strategy: trend, price action, support/resistance and momentum. Green/red bars indicate trend, custom ExCon indicator manages setups, pivots show support/resistance and MACD ties it all together. Clear entries, take profits and exits with simple rules for engagement.
In this course you will learn how to trade the following chart patterns: Trendline strategies, candlestick patterns, chart patterns, Elliot Wave Theory, harmonic patterns, risk management, trading plan, trading psychology and more.
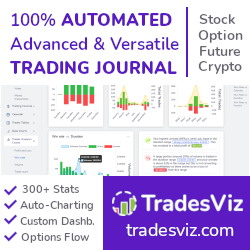
TradesViz is an advanced online trading journal. Auto-sync with NinjaTrader and Tradovate. It includes auto-plotted executions on charts and more than 300 statistics, including MFE, MAE, best-exit analysis and more! Auto-sync with brokers and discover your trading edge!
The Linear Regression Channel (LRC) is designed to truly detect when prices are overbought or oversold. Different than other LRC indicators, the width of the Stealth Traders LRC channel is based on a proprietary formula, designed to pinpoint opportune entry and exit signals. Upgrade Your LRC Today!
December 2, 2024
Mastering Sideways Markets With Auction Bars and Range Projections
November 19, 2024
Enhancing Your Automated Trading System: Key Insights from Best Pro Trade
November 14, 2024
NinjaTrader New Ecosystem Tools: October 2024 Edition
Enter Email for Updates