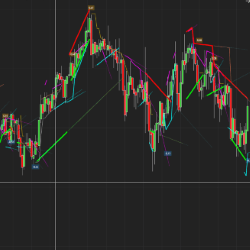
Trendlines can be drawn in so many incorrect ways. Drawing it incorrectly can make most trades losers and vice versa. Getting it right makes all the difference! QTL has a faster and far more accurate approach. Ready to automatically find the most accurate trendlines?
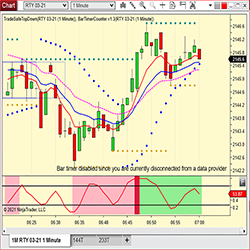
TradeSafe is a Boolean-logic, rules-based mechanical day trading system that automatically determines strength of trend and optimum exit strategy and plays audible spoken alerts. Nearly 100% automated, it uses benchmarking for consistency. Watch replay: https://daytradesafe.com/replay/
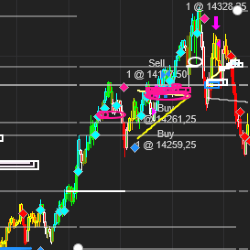
Q-Scalper indicator identifies the confluence dynamics between Support and Resistance levels with significant Trendlines, providing very significant trade levels. These levels produce very actionable and valuable trade set-ups. Click the link to explore this great indicator.
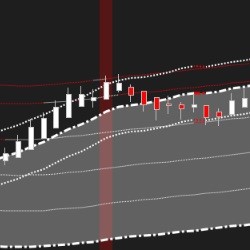
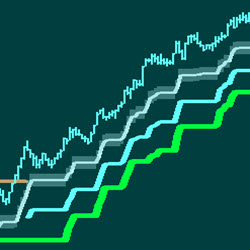
The Linear Regression Trend Lines Indicator dynamically balances the trend on your chart on all time frames. This indicator is built from several linear regression indicators and modified Keltner Channels. Set up to five offset multiplier levels for targets or reversals.
The ATR Stop is a simple but powerful tool to help the trader stay in a position longer and with greater confidence. Employs a proprietary “filter” to eliminate “false positives.” PTG ATR Stop Indicator is your confidence builder. Ask about PTG's Auto-Trade Assistant (ATA) Strategy.
Delta Polar Bars are a new Order Flow bar type built on polarity between delta and volume. They finely distinguish balance/imbalance zones and produce specific intra-bar delta patterns which help to identify reversal/trend continuation.
KingRenko$ is the real “face” of ninZaRenko. It has no artificial open and only real data, so you can see for sure the real OHLC of a KingRenko$ candle. As a result, KingRenko$ can be accurately backtested.
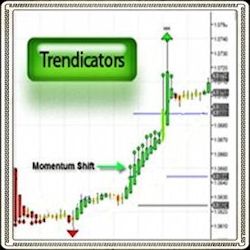
The Trendcators Indicator suite is designed to unclutter the market via built in analysis tools to pinpoint entry/exit signals with ease. It’s fully customizable providing you with the flexibility to determine which aspects of technical analysis are important for your trading! Get Started Now!
Start with an idea, work with our development team and then test your strategy. If it functions well, next deploy the strategy in paper trading mode and track each day’s performance. We provide support in Portuguese.
Passionate trader in couple who help you in understanding the pure reading of the heavy and light future market using the DOM TAPE. Different tools are available with help also on these. Mutual help and personalized support right through to the end.
December 2, 2024
Mastering Sideways Markets With Auction Bars and Range Projections
November 19, 2024
Enhancing Your Automated Trading System: Key Insights from Best Pro Trade
November 14, 2024
NinjaTrader New Ecosystem Tools: October 2024 Edition
Enter Email for Updates