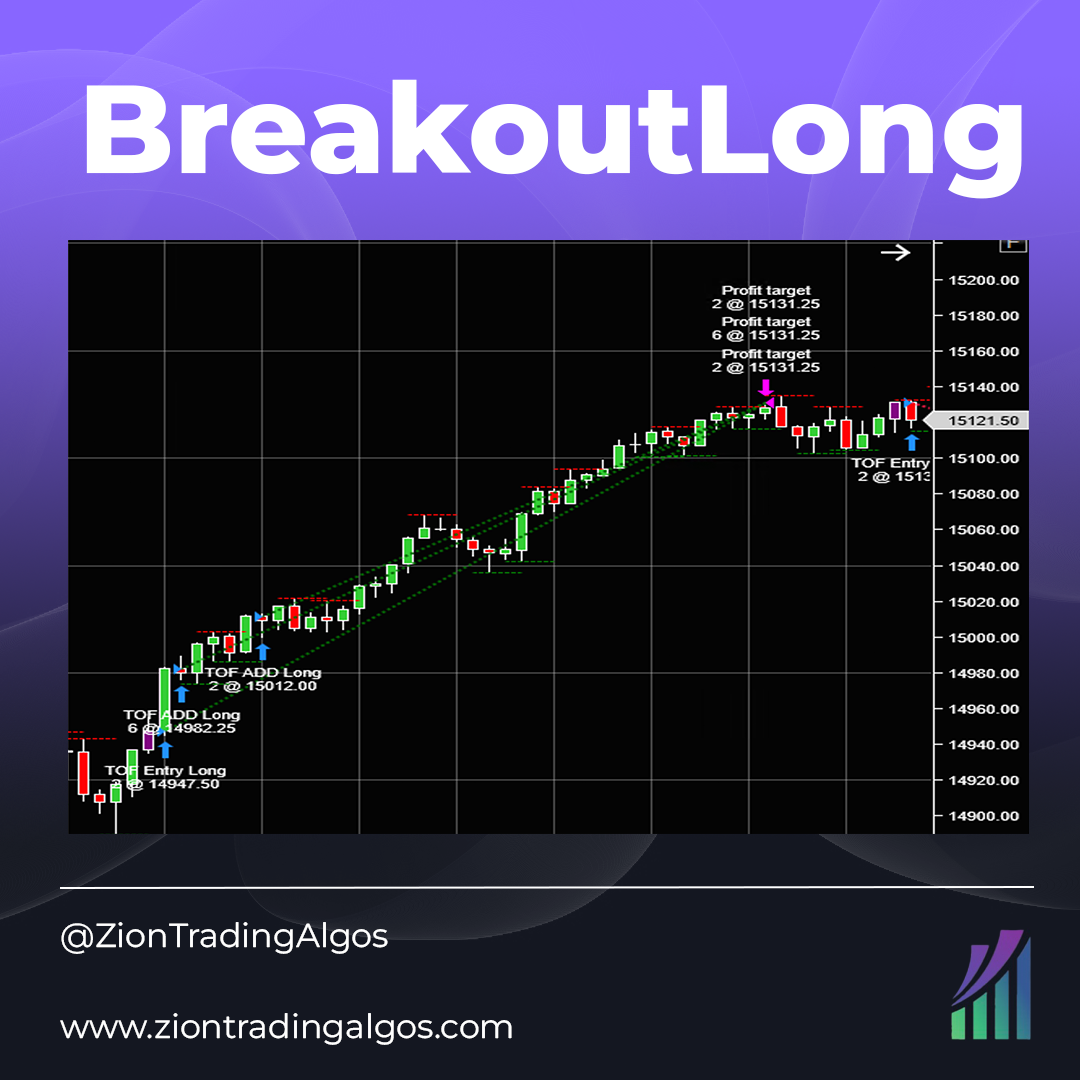
BreakoutLong is an intraday breakout system that trades on the 30-minute chart. It uses an EMA and looks for a specific price pattern-based breakout. It has volatility derived stop loss and take profit targets and only has a single entry and exit system. Tested on MES, MNQ and MYM.
The algorithm allows for fully automatic trading or semi-automatic. It works in Micro or Micro futures markets. For the algorithm to manage the trades, you can set a stop-loss and target from the configuration menu. If you want, you can also choose NinjaTrader’s ATM Strategy.
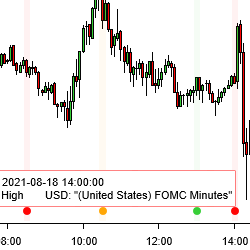
Improve planning of your trades by seeing when economic calendar news gets released – right on your NinjaTrader 8 charts. Option to select either Forex Factory or Myfxbook as news source. You can see news for the current week and historical news releases. You can also filter by news impact and more!
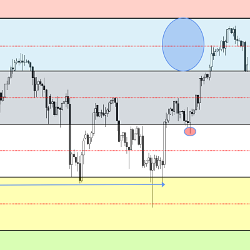
The E-widget is a suite of tools like a Swiss Army knife, offering customizable analytical solutions for traders. Use E-mini Wizard preset templates for Fibonacci levels, support & resistance, risk:reward ideas, regression trades, or build your own. E-widget is designed to work on all markets.
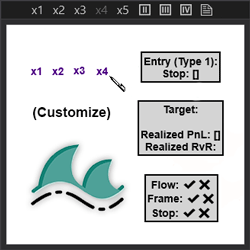
This indicator allows the user to create custom text buttons and quickly draw them on the chart, increasing application functionality and user charting efficiency.
The only things traders can truly control are stop management and position sizing. Risk Manager works with any system or collection of indicators. It also provides the means for you to launch ATM strategy templates for better money management. Maintain great trade management with every trade!
Strong momentum cannot be maintained! Traders will always exit their position at a certain level, which causes price to pullback or retrace. Measuring strong momentum can help the trader to anticipate the eventual exhaustion. An award winning "heads-up display" indicator from The Intentional Trader!
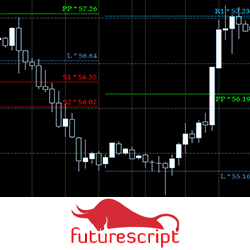
The Pivot is based on the classic pivot point indicator with a few twists and innovations. These levels present a very straightforward approach to buying and selling critical points as the session plays out using good risk/reward disciplines.
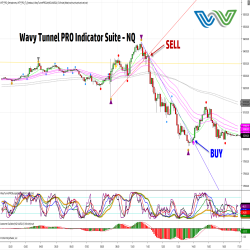
The Wavy Tunnel PRO ELITE Scanner Tools and Market Analyzer simplify finding trades. Set chart alerts for easy monitoring. The ELITE Tools save time by highlighting trades with visually appealing setups in line with the market cycles. Good for momentum, day and swing trading on all asset classes.
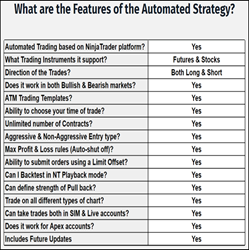
Automated trading tool designed to execute any futures contract based on a combination of predetermined settings and user-defined parameters. It aims to provide high-quality and statistically improved trade entries. One can use these strategies for day trading, and/or scalping intraday price moves.
December 2, 2024
Mastering Sideways Markets With Auction Bars and Range Projections
November 19, 2024
Enhancing Your Automated Trading System: Key Insights from Best Pro Trade
November 14, 2024
NinjaTrader New Ecosystem Tools: October 2024 Edition
Enter Email for Updates