CrossTrade connects TradingView to NinjaTrader. Easily automate your strategies on TradingView and execute them directly on NinjaTrader desktop.
A powerful self-study program that will help you learn the core principles and implementation of the Hunt Volatility Funnel Method with a total of 18 hours of material, topic by topic, alongside case studies and live trading webinars.
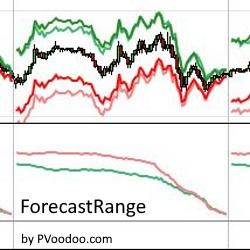
The PVForecastRange indicator calculates price moves and sets targets based on previous days’ statistical volatility. Try it for free!
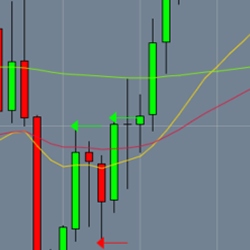
One minute chart entry indicator after a trend reversal on the 5-minute chart. The indicator looks for the first entry after hitting the 20EMA, and a W bottom or M top depending on the direction afterward. All that is needed is a 20EMA on the 5-minute, and a 20EMA and 200EMA on the one minute.
Unlock your trading potential through Factor-Model Implementation & Quantitative Trading with Python! Master factor-based strategies for quantitative trading. Learn essential Python for financial markets, swiftly implement your ideas, and elevate your trading. Enroll now for a competitive edge!
Toni Hansen is uniquely positioned to share over two decade’s worth of trading secrets, methodologies and financial strategies with clients in this highly interactive and market-focused learning environment.
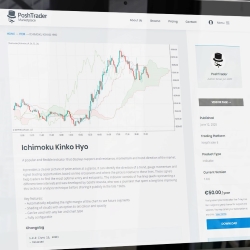
PoshTrader is a fintech company based in Estonia that specializes in custom development and out-of-box solutions for traders. We convert, retain and increase the lifetime value of trading platforms. Our work focuses on enhancing the trader's experience and performance.
Do you want to overcome the challenges that often leave traders feeling overwhelmed and uncertain? Introduction to the Trader Brain will give you the practical knowledge to solve your money-losing patterns.
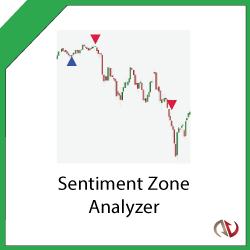
Use the Sentiment Zone Analyzer to measure overall market sentiment to spot trend reversals early! Based on the premise that extremely bullish or bearish tendencies will eventually lead to trend reversals. Dynamically calculates overbought and oversold levels based on previous price action.
Live trading room for ES S&P 500 day traders. Based on Rose’s Fibonacci trading system, charts are posted and price action shared. Previous trades are reviewed so that students can improve. Discord chat room goals: help students become independent traders & provide a supportive community.
December 2, 2024
Mastering Sideways Markets With Auction Bars and Range Projections
November 19, 2024
Enhancing Your Automated Trading System: Key Insights from Best Pro Trade
November 14, 2024
NinjaTrader New Ecosystem Tools: October 2024 Edition
Enter Email for Updates