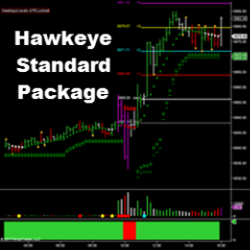
Hawkeye Standard Package is Hawkeye Traders' most popular indicators, providing trend and volume analysis across multiple markets. These powerful indicators tell traders when a trend is commencing, in congestion, and where to find the correct exit. Buy now using code: “NT10Off” for a 10% discount!
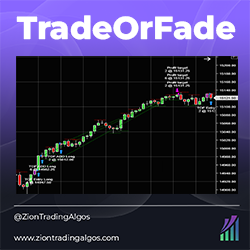
TradeOrFade is a momentum-based intraday strategy on the 5-minute chart. It determines whether or not there is an opening gap on NQ and takes advantage of statistically relevant information regarding gap ups and gap downs. It takes a starter position and pyramids into the position.
Trade with the best conditions in order to become an extraordinary trader, follow the risk management rules and reach your target in as little as 10 days. Once you have completed the target, we will connect you with one of our funding partners.
The Spread Trading Tool add on for NinjaTrader 8 allows for charting a variety of spread combinations from 2 leg 1:1 ratio spreads to more advanced butterfly spreads. A control panel connected to the strategy allows for easy entry and management of spread trades.
NinjaScript development covering the full range of capabilities in NinjaTrader 7 & NinjaTrader 8. QTradez develops custom indicators, strategies, bar types, SuperDOM columns and more to enhance Add On functionality. Fixed pricing is available for well-defined projects! Get in Touch Today!
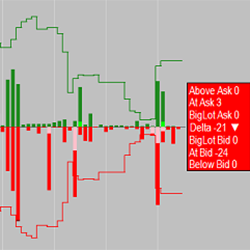
Use the Tape? Time & Sales can be hard to follow; however, this indicator boils it down to an easy to read histogram. Easily see the bid & ask trades, above ask & below bid trades, BigLot trades, the delta bid/ask ratio and much more. Learn more about the BigLotHistogram indicator now!
Bstrader-automatic is a powerful trend following automated trading system. It has customizable parameters, different position sizing methods, fixed size, equity percentage, atr, price percentage, ATR Trailing Stop, Market Money Scale In and Scale Out, Volatility Compass, Daily loss limit and more.
Don't miss any more targets by a few ticks with Target Zone!
VWAP MNTrader strategy is a fully automated trading system. Trading is based on the VWAP indicator for the daily, weekly and monthly periods on the breakdown test strategy with a filtering system. It has an improved position support system with flexible settings to improve trading consistency.
Fully-automated. The VMX selects a time of day to trade during the cash session for stock index futures. This system takes advantage of the volatility created by big institutions moving asset allocations in the equity markets. All positions closed before the end of the cash session.
December 2, 2024
Mastering Sideways Markets With Auction Bars and Range Projections
November 19, 2024
Enhancing Your Automated Trading System: Key Insights from Best Pro Trade
November 14, 2024
NinjaTrader New Ecosystem Tools: October 2024 Edition
Enter Email for Updates