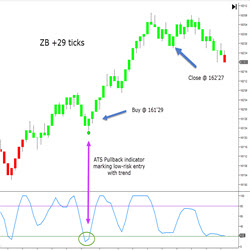
The TrendContinuation indicator identifies and alerts the trader of high probability continuation trades in the direction of the major trend. Using a time tested algorithm for determining possible low risk entries, this indicator marks the location and can notify the trader via email or text.
The Ichimoku Mentoring Program contains 4 weeks of pre-workshop webinars, a live 2-day boot camp, 2 months of post course mentoring, access to the trade room & Ichimoku research center. Learn more!
The Volume Profile Learning Pack includes 44 in-depth training videos, 15 hours of video content and hundreds of real trade examples, including forex, futures, indexes, and stocks. It also includes custom-built Volume Profile indicators for NinjaTrader 8.
Storm Eye enhances trading accuracy by leveraging fake breakouts to pinpoint optimal entry points, offering a sophisticated and reliable method for navigating market turbulence. It operates through a three-step process: Identifying a breakout, detecting a breakaway, and generating a signal.
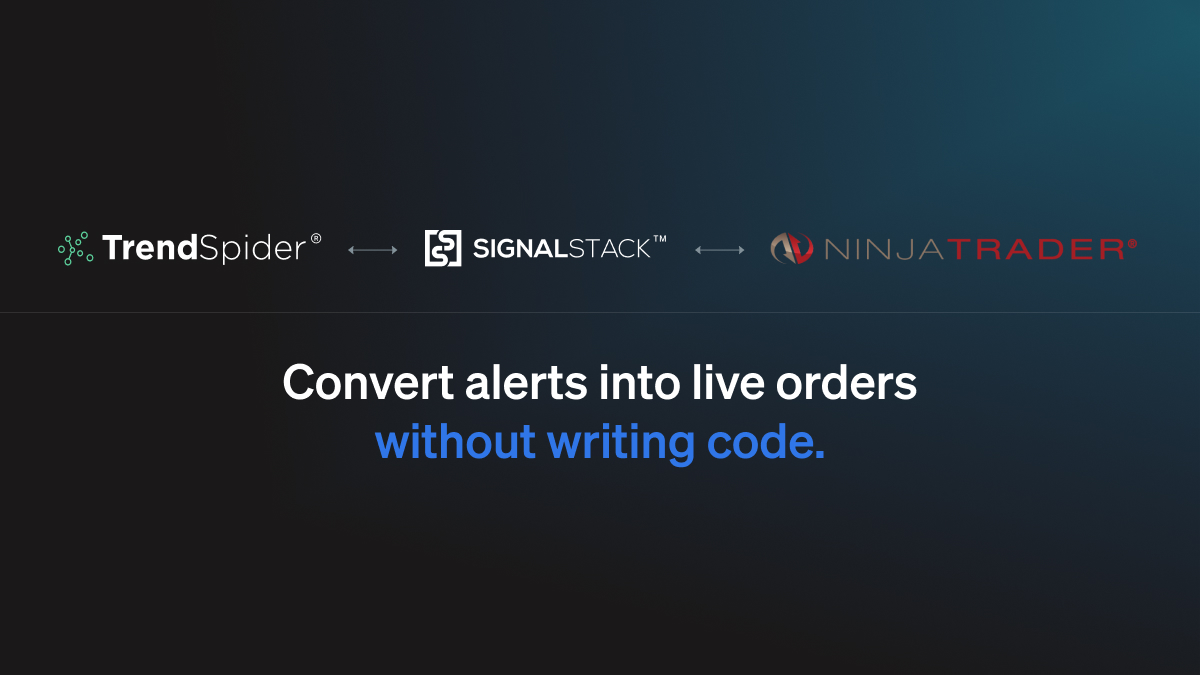
SignalStack is a fast, easy and simple way to convert any alert from any trading platform into an executed order in any brokerage account – automatically and without writing any code.
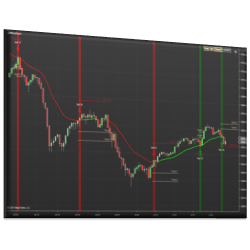
This indicator plots signals, targets, and stops based on support and resistance from various moving average types. The trend is established based on a minimum number of bars above or below the moving average. The signal is initiated on the first touch of the moving average.
Learn to code automated strategies, indicators and add-ons for NinjaTrader 8. Join our NinjaScript custom programming course. No prior programming knowledge is required. Learn from beginner to expert level in live sessions tailored for custom NinjaScript programming.
Innovation in Momentum: SPEARHEAD is a cutting-edge indicator for traders and investors. It compares the momentum of two instruments, with one being a custom synthetic instrument created by the user, incorporating up to seven assets like stocks, commodities, currencies, etc. Also in Spanish.
PFAZoneSuite is advanced supply and demand trading! Indicator package includes automated volume zones, volume profile, order flow analytics, trend lines, fibonacci retracements, market structure, trade data box and more! Compatible with NinjaTrader 8. Click here for a free demo!
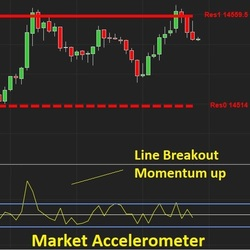
The E.G. AI Accelerometer reveals the driving force behind the price movements of an asset; by measuring how many buyers and sellers are in a market, it helps you form a view of the future direction of the price and – crucially – how fast that movement may be.
December 2, 2024
Mastering Sideways Markets With Auction Bars and Range Projections
November 19, 2024
Enhancing Your Automated Trading System: Key Insights from Best Pro Trade
November 14, 2024
NinjaTrader New Ecosystem Tools: October 2024 Edition
Enter Email for Updates