To receive their free Weekly Market Movers trading schedule, just enter your email in the "" Get Free Training Video "" box. See how they schedule their trades each week as they will email you their free weekly trading schedule.
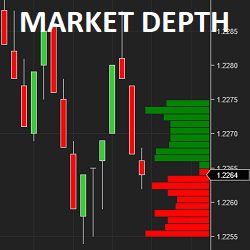
itcMarketDepth is an indicator used to read depth of market data. Reading the depth is useful to qualify key support & resistance levels. This helps traders to know if a level will hold or break. itcMarketDepth can be customized by color, size of bars, filter, number of elements to display & more.
Trail a stop automatically behind a wide range of indicators: Price Action, ATR, Bollinger Band, Swing, Parabolic SAR, Donchian Channel, or 9 different Moving Averages. Trailing Stop Expert works on Futures, Forex or Stocks. Grab a 7-day free trial now!
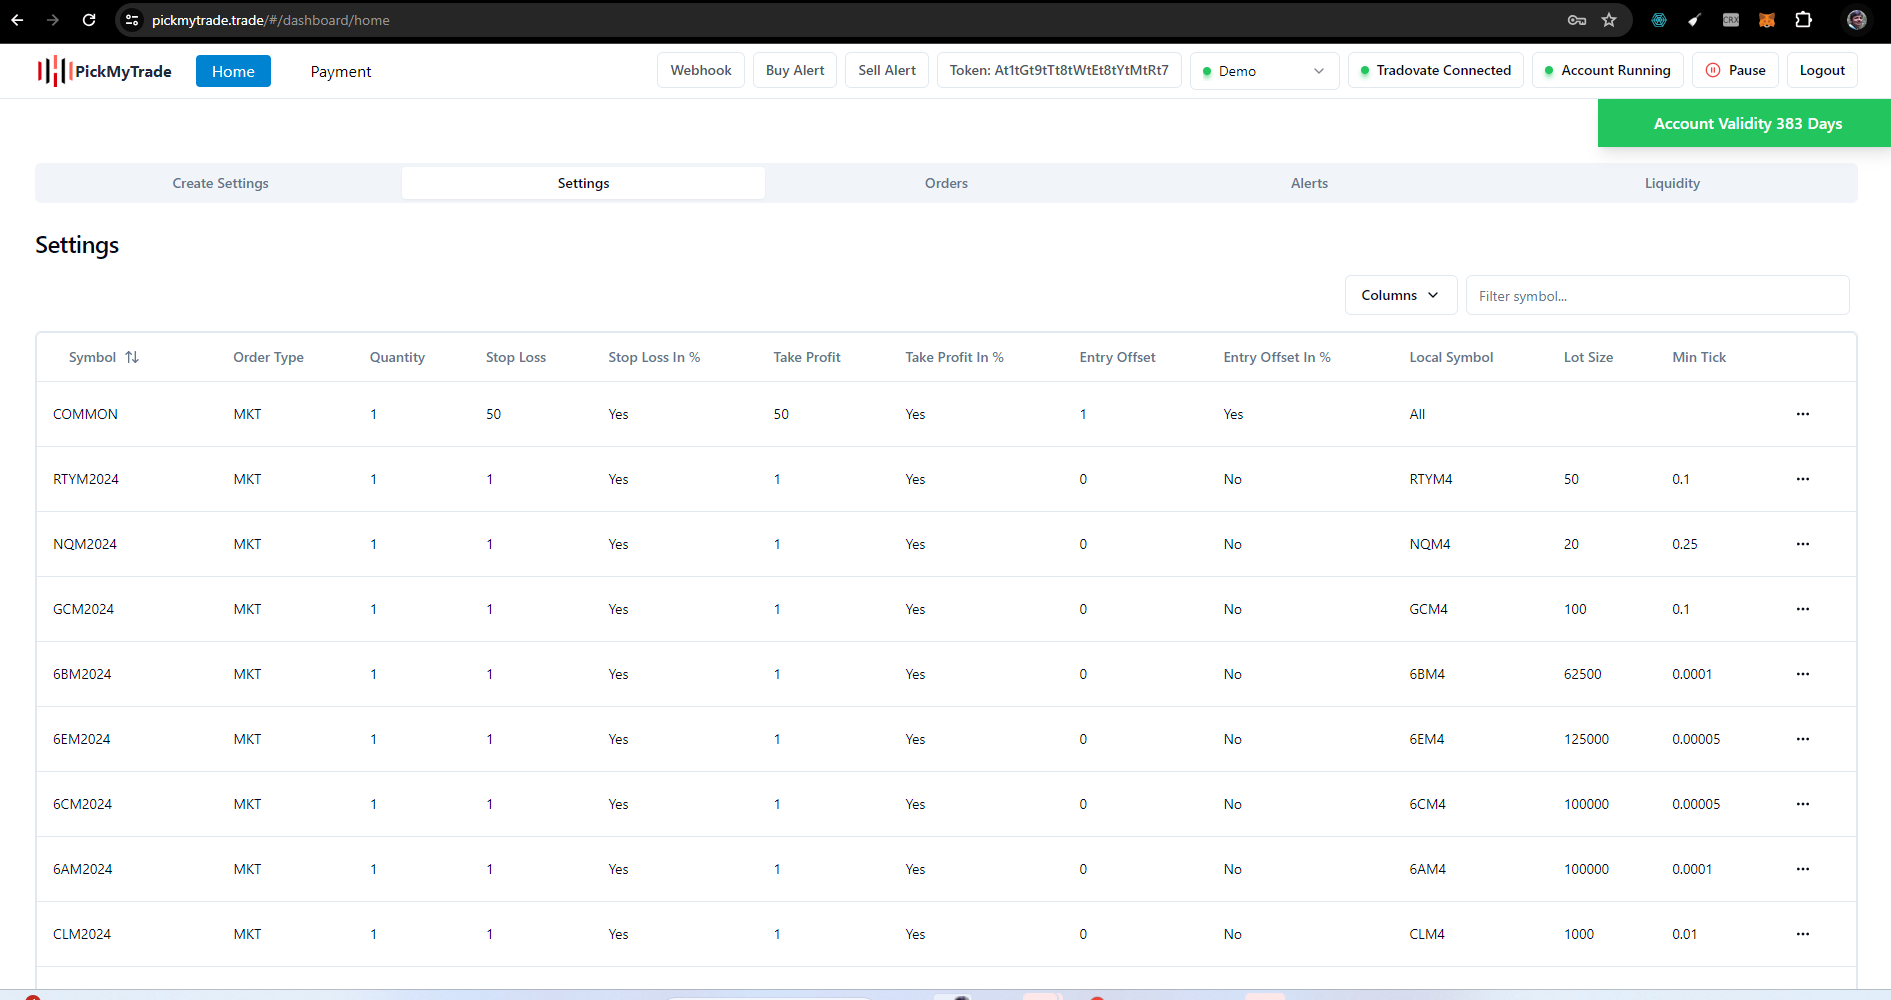
PickMyTrade specializes in automating trading bots, enabling seamless strategy execution for futures across well-known brokers such as Tradovate.
The Ultimate Pivot Points™ (UPP) Indicator Package is the most advanced and extensive collection of “Pivot Points” Indicators available. It includes every “Pivot Point” method along with several innovative features — making it one of the most complete Support/Resistance indicators on the market!
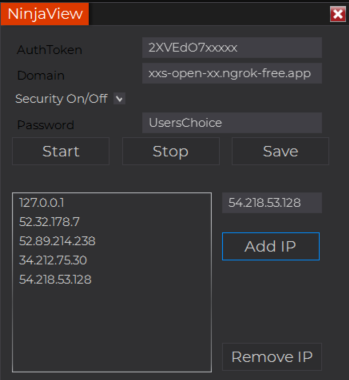
TradingView to NinjaTrader webhook. Automate your TradingView scripts directly into NinjaTrader. Webhook can use ngrok for free public facing domain or be used as a standalone locally for quicker execution. Extra features include custom password protection and IP whitelist for added security.
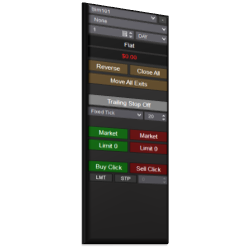
The Advanced Stop Loss Management module adds the ability to manage your stop loss orders and switch between various trailing stop methods on the fly.
Spot the calm before the storm for both breakouts and breakdowns with this ultimate volatility indicator! Spot bullish accumulation and consolidation points before strong upward breakouts and continued bullish trends. Find points of failing strength at plateaus and tops before drops.
Ichimoku MNTrader is a fully automated trading system. Trading is based on the Ichimoku Kinko Hyo indicator, patterns and zigzag to filter out false signals and build more accurate analysis. It uses Renko charts and is suitable for all futures and Forex trading instruments.
KingRenko$ is the real “face” of ninZaRenko. It has no artificial open and only real data, so you can see for sure the real OHLC of a KingRenko$ candle. As a result, KingRenko$ can be accurately backtested.
December 2, 2024
Mastering Sideways Markets With Auction Bars and Range Projections
November 19, 2024
Enhancing Your Automated Trading System: Key Insights from Best Pro Trade
November 14, 2024
NinjaTrader New Ecosystem Tools: October 2024 Edition
Enter Email for Updates