This Order Flow indicator package takes the information overload out of interpreting complex footprint charts and volume data by doing the calculations internally, and then plotting easy to read objects on the chart. Your membership includes the software, one month trade room access and mentorship.
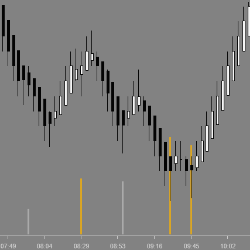
EPyFMomentumCandles is an indicator which helps to detect momentum. When a setup is confirmed by a momentum candle, we pay special attention as this is an important factor in our analysis. This indicator is also used to identify relevant areas during each session.
Use our Auto-Swing Pattern Finder to help find potential market patterns! Swing Pattern Trading is a methodology that utilizes the recognition of specific price patterns and the alignment of exact Fibonacci ratios to determine probable reversal points in the financial markets.
ChartIdentifier renders instrument information directly on the chart to assist with easy chart identification. Choose what instrument format you want to display and optionally add a prefix value.
Virtual Private Server (VPS) technology provided by your hosting provider lies at the core of NinjaTrader VPS options. For instance, this service, offered at an affordable price with a guarantee of premium speed and reliability, is available through the expertise of AvaHost.
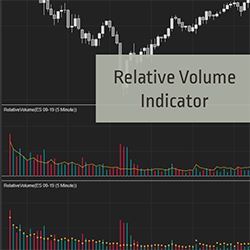
Detect unusual or below average volume easily. Identify the start or end of a move with no effort. Relative Volume (RVOL) compares current volume to the average volume for the same time of day. Start your 2-week trial now!
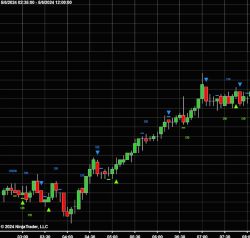
The Turn Around Signal indicator can locate and label locations of reversal / turn-arounds in price action. When combined with the proper retracement, this signal can produce great results by identifying directional changes and pullbacks. Also identifies and labels Double Bars, Doji’s and Pinbars.
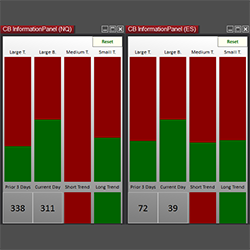
CB Information Panel gives you a snapshot of the buyers and sellers. Keep track of the prior day’s ranges and trend movement.
The ATR Stop is a simple but powerful tool to help the trader stay in a position longer and with greater confidence. Employs a proprietary “filter” to eliminate “false positives.” PTG ATR Stop Indicator is your confidence builder. Ask about PTG's Auto-Trade Assistant (ATA) Strategy.
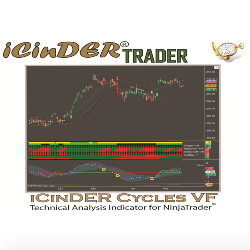
The iCinDER™ Cycles VF (Velocity Force) indicators allow for a quick validation of analysis, thus speeding up reaction time to market movement's bias. The analysis is based on velocity force of the instrument being analyzed.
December 2, 2024
Mastering Sideways Markets With Auction Bars and Range Projections
November 19, 2024
Enhancing Your Automated Trading System: Key Insights from Best Pro Trade
November 14, 2024
NinjaTrader New Ecosystem Tools: October 2024 Edition
Enter Email for Updates