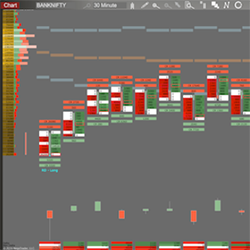
Bell R-Delta Alert provides a 360 degree microscopic view of the markets and is particularly designed for Scalpers, Intraday and short term players. The Bell R-Delta features onscreen, audio and email alerts!
Tradesyncer is a powerful trading solution that synchronizes all your futures (prop firm) trading accounts across multiple brokers, platforms, and data feeds. This dashboard lets you monitor and manage your trade data, ensuring efficiency and insights from one centralized location.
The indicator produces a Fibar signal based on three criteria: a reversal bar, retracement, and subsequent price return. Specifically designed for the KingRenko$ bar, it stands as an indispensable tool for making precise scalping decisions.
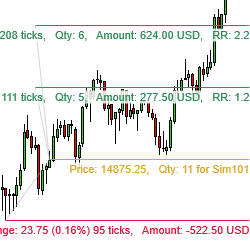
Calculate your position size automatically by drawing a stop loss and entry and target levels on your charts – and, optionally, submit the associated orders. When the instrument currency is different than the account currency, it automatically calculates all amounts in the account currency.
This indicator allows the user to create custom text buttons and quickly draw them on the chart, increasing application functionality and user charting efficiency.
David Misselhorn is a software developer with over 30 years of development experience in trading clients, market data and order-execution software. He writes indicators and strategies for individuals wishing to automate their trading and analysis activities.
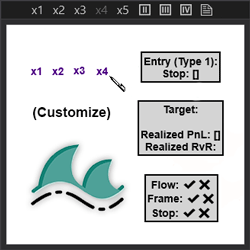
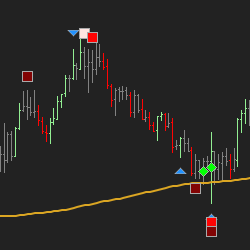
The Visualized Trader helps make trade signals easy to see by measuring 5 uncorrelated energies of money flow. When they are all bullish or all bearish at the same time it plots a simple red or green box on your chart, eliminating the need to clutter your chart with a lot of indicators.
Anchored VWAP: A dynamic tool for trading strategies. Coding friendly: One of the standout features of the Anchored VWAP is its coding friendliness. Users can seamlessly integrate it into the code of any NinjaTrader strategy, allowing for easy implementation and customization.
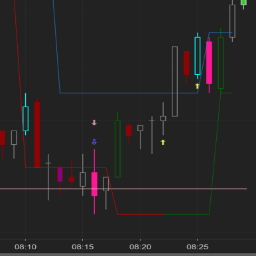
The Price Action Analyzer helps identify and alert price action events when the market enters your reversal area. This tool supports Hidden Gap Bars, Inside/Outside Bars, Up Thrust and Spring, No Demand and No Supply, Effort to Rise, Effort to Fall and Stopping Volume!
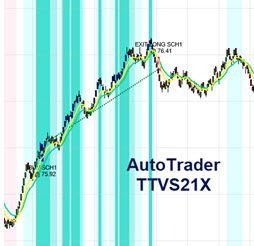
Comprehensive automated system, including 20 strategies, covering a broad range of instruments and market conditions. Includes indicators, color backgrounds and a powerful money management module to protect profit and principal. Lease includes training and support.
December 2, 2024
Mastering Sideways Markets With Auction Bars and Range Projections
November 19, 2024
Enhancing Your Automated Trading System: Key Insights from Best Pro Trade
November 14, 2024
NinjaTrader New Ecosystem Tools: October 2024 Edition
Enter Email for Updates