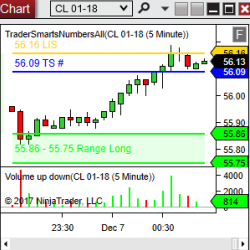
TS Trades is live market commentary, focused on identifying trade setups that are forming in real-time based on input from TS TradePlan. Get started with a 2-week trial for your favorite markets.
Semi-auto trading tool used to help enter and manage trades when using Renko style charts. Customize entry condition, stops, targets, breakeven and trail.
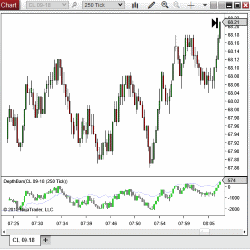
The Depth Bars & Pull-stack indicators by PureAlgo Capital detect changes in the total bid depth and total ask depth, providing a better idea of whether the bulls or bears are in control of the market & which players are about to fold.
Elevate your trading strategy with the Volume Levels Indicator. Detecting support and resistance from volume, it delivers precise levels respected by the price. Features include order flow cumulative delta integration, real-time order block detection, an age counter for significance tracking & more.
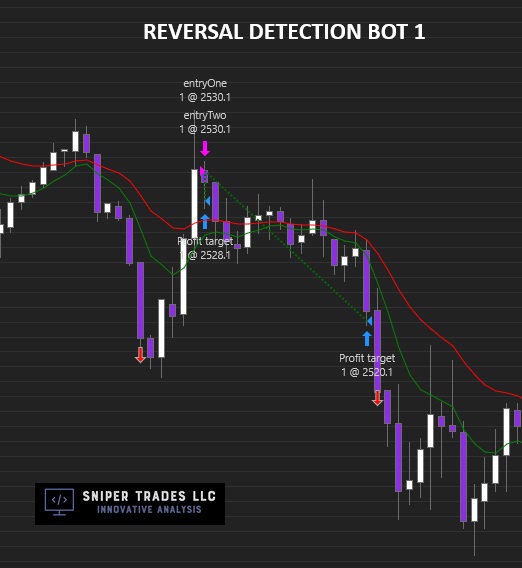
This fully customizable bot will look for a trade setup pattern, indicate the expected direction (arrow up or down), and then wait for the price action to pullback to either the 9 EMA (green line) or the 21 EMA (red line) to enter into the position.
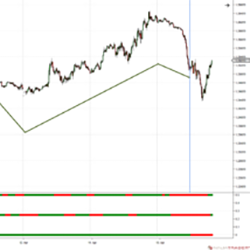
The EnlightCoders HeadScalper gives you market direction with a traffic light plot – red or green. SAT (Scalp Auto Trend) is a versatile and self-adapting tool to identify what is happening in the big picture. It reduces noise with smart filters and shows just one thing: the trend in red or green.
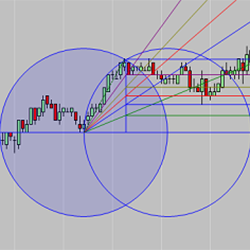
Attention Fibonacci, support/resistance, Gann & market structure enthusiasts! The HarmonicFan draws an A-B line & 2 intersecting arcs are calculated. The upper or lower half of the resulting Vesica Piscis formation is then divided into Fib levels & trend lines are then created as a fan. Learn More!
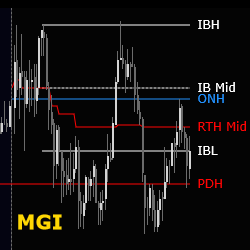
This free MGI (Market Generated Information) indicator automates the process of adding useful information on your chart to help identify trading opportunities, market context and areas of interest to help guide decision making. Three indicators are offered for daily, weekly and monthly time frames.
Free daily newsletter - global news & views; free weekly YouTube (Sunday) to prepare you for the week ahead; 1-day workshops; 1-week courses zero to hero; accredited masterclass financial & commodity trading; flexi-masterclass, which includes a free trading challenge; and trader mentoring.
Market Analyzer Column: Effortlessly tailor real-time market data to your needs.
December 2, 2024
Mastering Sideways Markets With Auction Bars and Range Projections
November 19, 2024
Enhancing Your Automated Trading System: Key Insights from Best Pro Trade
November 14, 2024
NinjaTrader New Ecosystem Tools: October 2024 Edition
Enter Email for Updates