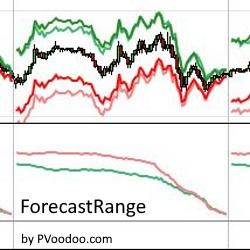
The PVForecastRange indicator calculates price moves and sets targets based on previous days’ statistical volatility. Try it for free!
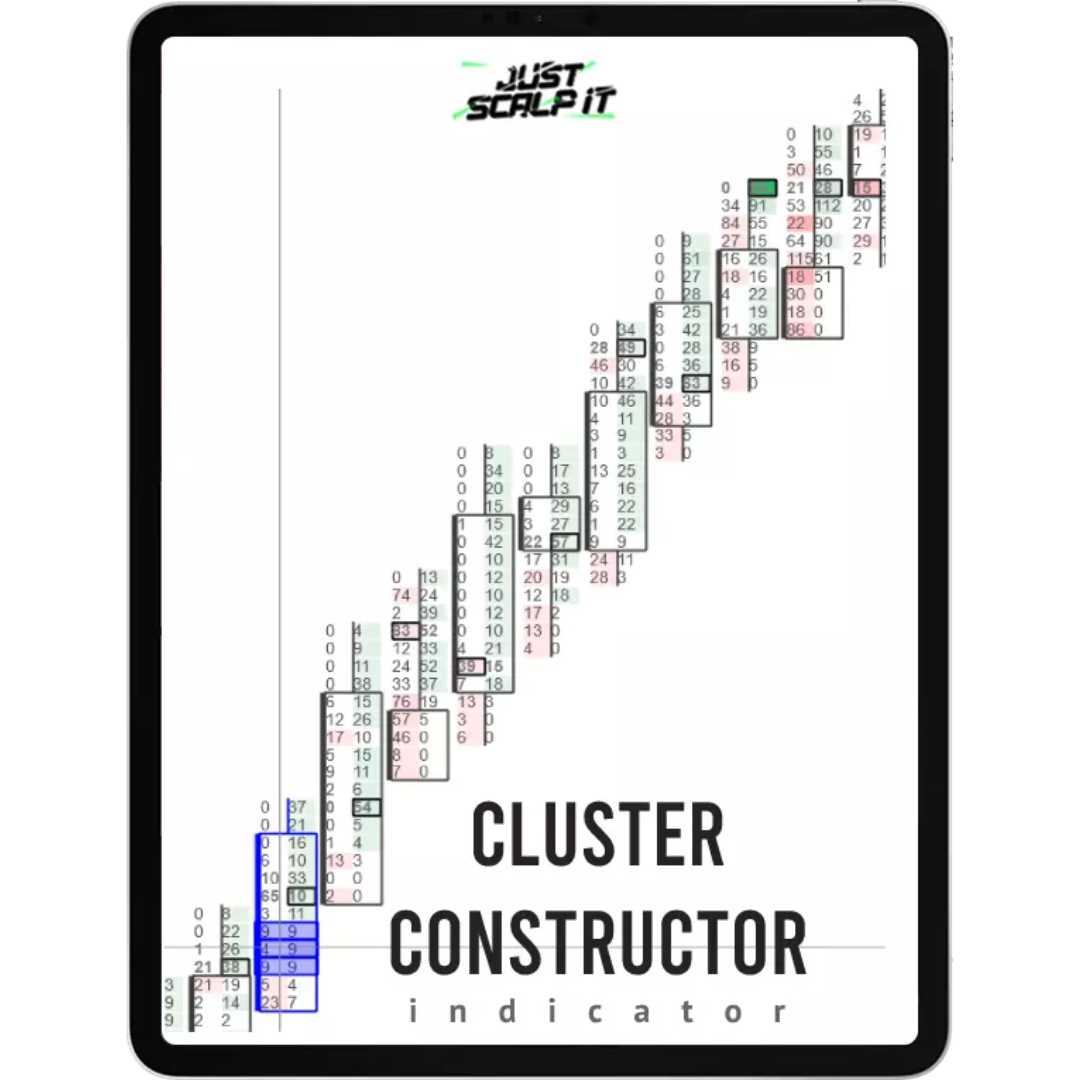
Explore the advanced order flow indicator, Cluster Constructor, featuring 16+ filters for deep market analysis (footprint charts). Ideal for unveiling smart money and institutional trends, enhancing order flow trading strategies. Delve into sophisticated insights – start now!
Chompsky Bands: Single and second entry reversal signals and momentum signals, including MACD V5 signals. Includes min/max Bars Per Minute (BPM) filter, Trend Resilience, EMA Tick Separation Filter, Wave Counter. Signal outputs and customizable tags.
Identify market inefficiencies by marking fair value gaps (FVGs) on the chart that meet predefined size criteria. The indicator distinguishes between bullish and bearish gaps and changes their color once they are inversed. It provides clear visual cues for potential rejection trades from these gaps.
Learn a battle-tested strategy for trading the markets in under 60 mins per day. Here’s just a fraction of what you’ll learn: How professional traders find good trades, how to read the markets and a market that has unique advantages over others.
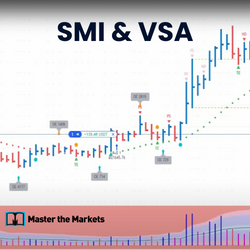
SMI was developed by the quants in the 1960's to help quantify tops and bottoms. It gives 3 strategy stats based on probabilities. However, a small limitation of the SMI is in selecting the T&Bs that are going to run. VSA helps you overcome that by looking at the volume for a big move.
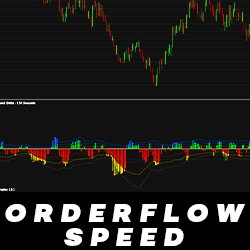
Deceptively simple, Orderflow Speed allows you to monitor market speed and enables you to view trading activity directly from your chart. It supports the Tick Replay feature so that you can visualize historical trading activity.
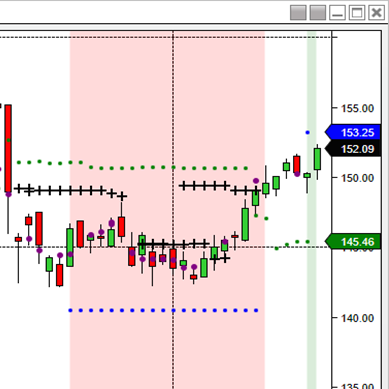
The iMTF® Ichimoku indicator features multi time frame support/resistance levels using crosses (long term) and purple dots (short term). Cloud breakouts are represented by green and red shaded areas to identify buy and short sale zones after an instrument has broken out of the cloud.
This course, in French, details the step-by-step path to profitability, from the basics of trading to order flow, and the best known indicators. This course is the result of months of work and years of experience. Satisfied or your money back for 14 days – try it out!
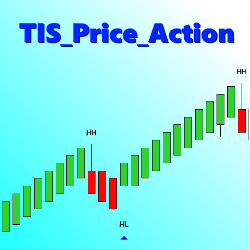
The TIS_Price_Action indicator detects and ranks pivots, then looks for a user specified sequence, such as Highest Low followed by Highest High to paint a long signal. Users can trigger 1 to 3 pivots to trigger a signal.
December 2, 2024
Mastering Sideways Markets With Auction Bars and Range Projections
November 19, 2024
Enhancing Your Automated Trading System: Key Insights from Best Pro Trade
November 14, 2024
NinjaTrader New Ecosystem Tools: October 2024 Edition
Enter Email for Updates