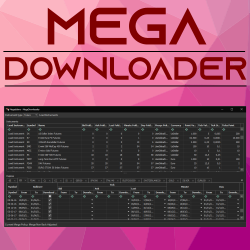
The MegaDownloader add-on allows you to download historical data asynchronously in a single window. Load instruments by type and view specifications and all available expiries for each instrument, including rollover period and date/time range for tick, minute, and day-based periods.
The indicator produces a Fibar signal based on three criteria: a reversal bar, retracement, and subsequent price return. Specifically designed for the KingRenko$ bar, it stands as an indispensable tool for making precise scalping decisions.
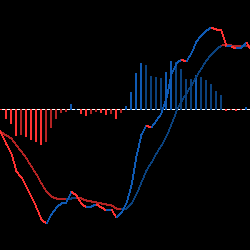
Our MACD Colours is The Prestige Trading Software’s own interpretation of a classic indicator, the MACD. Our version uses a price-reactive color scheme for the elimination of doubt, with everything to the long side turning blue and everything to the short side turning red. Try it for free.
Chompsky Fibs with Measured Moves: Auto plots the 61.8% zone and 38% zone with color changing for bias. Customizable Tags and signals for custom adoption from bots such as Trade Saber's Predator.
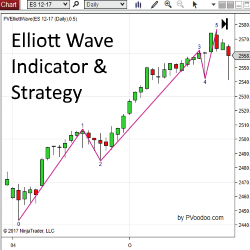
PVElliottWave Indicator is an Elliott Wave indicator designed for the NinjaTrader platform. Get started with a free trial of this indicator now!
Mentor one to one what you'll find inside: 8 hours of live lectures, 4 hours of live backtest, community discord lifetime live weekly backtest, weekly live review, live archive, markup price action, lifetime updates on new concepts, private structure indicator.
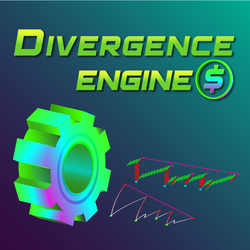
This is a UNIVERSAL solution to regular divergence trading. Divergences can be identified by comparing price action and an oscillator of your choice. Yes, you can freely use this NinjaTrader divergence indicator with RSI or MACD, stochastic, CCI, and other indicators, from any vendors!
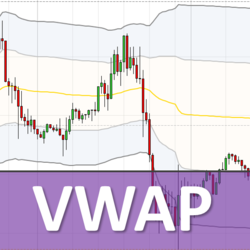
VWAP shows S/R levels, which the majority of institutional algorithms use. It works with all trading instruments (Forex, Futures, Indexes, Commodities, Stocks) and time frames (day trading, swing trading, position trading). It includes VWAP Training Video Course and VWAP trading setups.
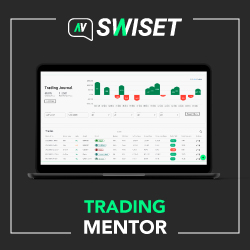
Trading Mentor is an automatic system based on data science which helps traders understand the most important insights of their trading and adjust their trading strategies for consistent results.
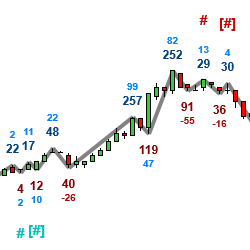
MBoxWave Algorithmic Buy / Sell Signals use Wyckoff concepts in analyzing waves, volume, delta volume, effort / result, etc... It allows you to easily scan charts for certain conditions to meet a criteria and then showing a signal that a potential trade setup has occurred.
December 2, 2024
Mastering Sideways Markets With Auction Bars and Range Projections
November 19, 2024
Enhancing Your Automated Trading System: Key Insights from Best Pro Trade
November 14, 2024
NinjaTrader New Ecosystem Tools: October 2024 Edition
Enter Email for Updates