Since 2005, Whitmark Development is a full-time, US-based NinjaScript consultant that offers custom coding services with special expertise in fully-automated strategies, delivering innovative solutions for traders and vendors with full-service support. Call or Email for a project consultation!
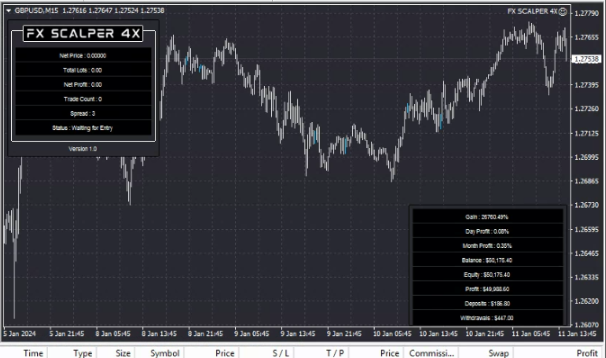
FX Scalper 4x is a fully automated robot for currency pairs. It's suitable for both propfirm account and personal account. FX Scalper has a unique and easy to access dashboard. FX Scalper 4x costs $200.
This model balances four separate risk lenses that seek to generate alpha while moderating standard deviation over multi-year periods. Each risk lens is independently applied based on Alpha Vee's breakthrough fundamental momentum research. Contact Alpha Vee for more information.
This self-paced course covers everything you need to know about using Visual Studio and NinjaTrader 8 together: installation, organizing code, source control, projects, assemblies, 3rd party code, NuGet packages, debugging and more. We offer a 30-day money back guarantee. Click to learn more!
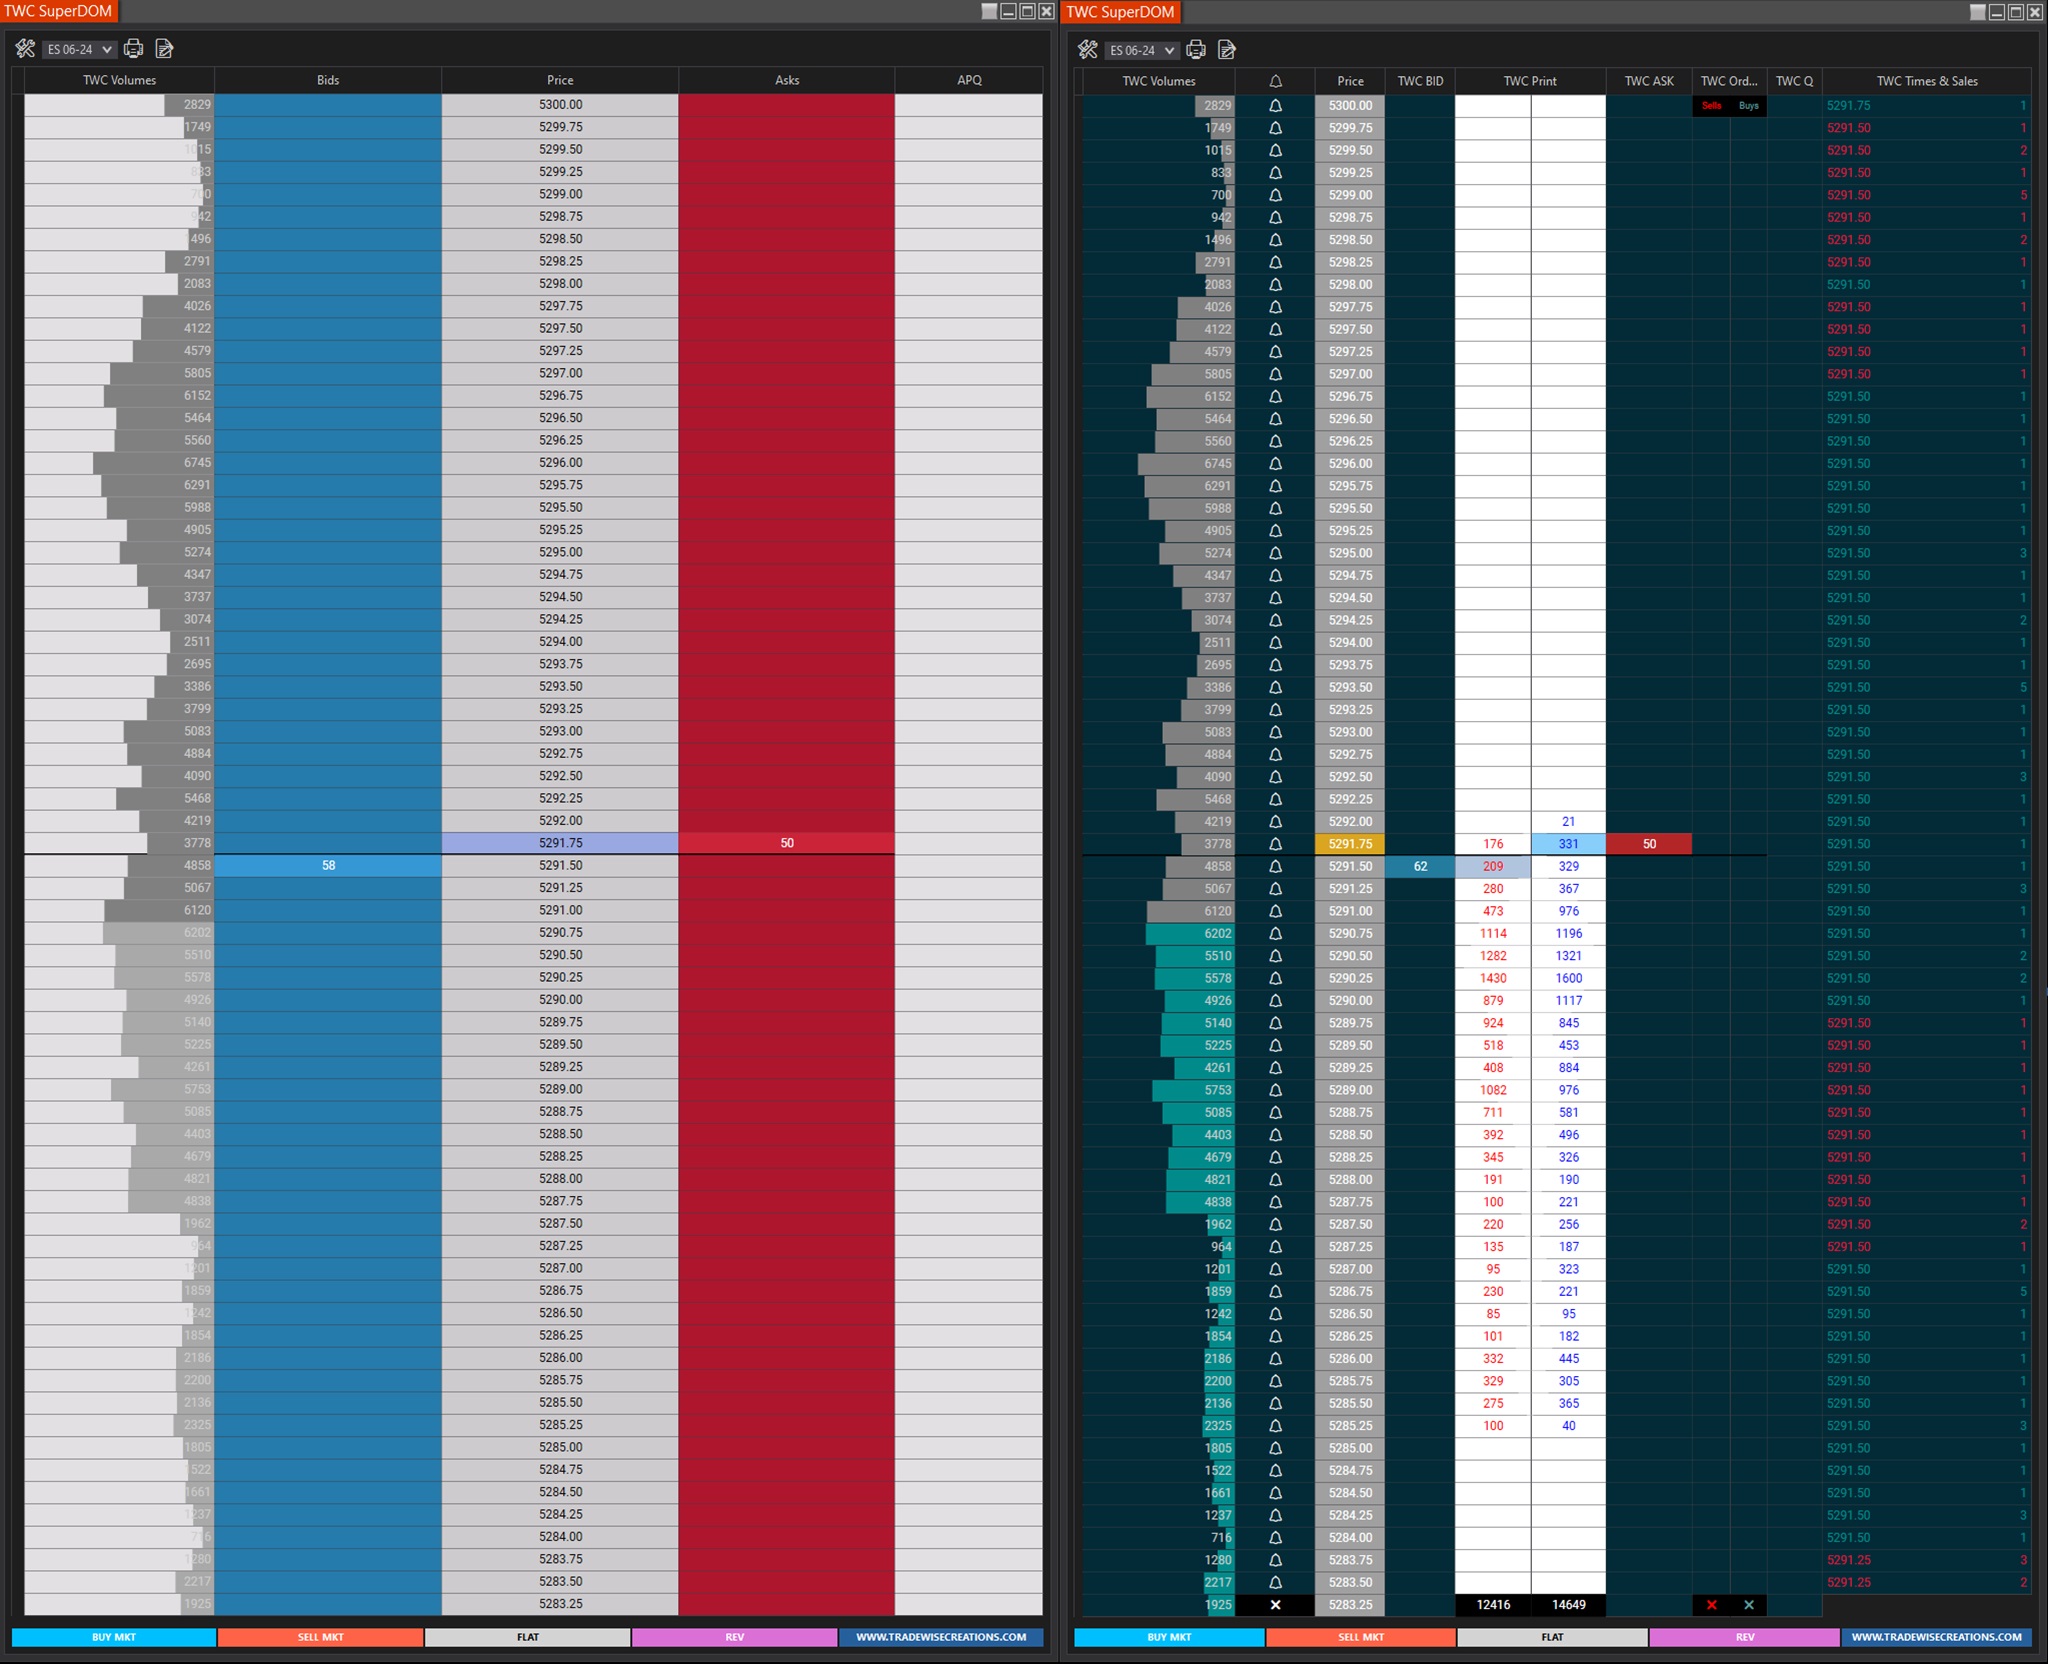
The Super Dom TWC displays a list of all buy and sell orders for a given asset, such as futures and currencies, along with corresponding prices and quantities. The team included all the essential setting and functionalities that traders need.
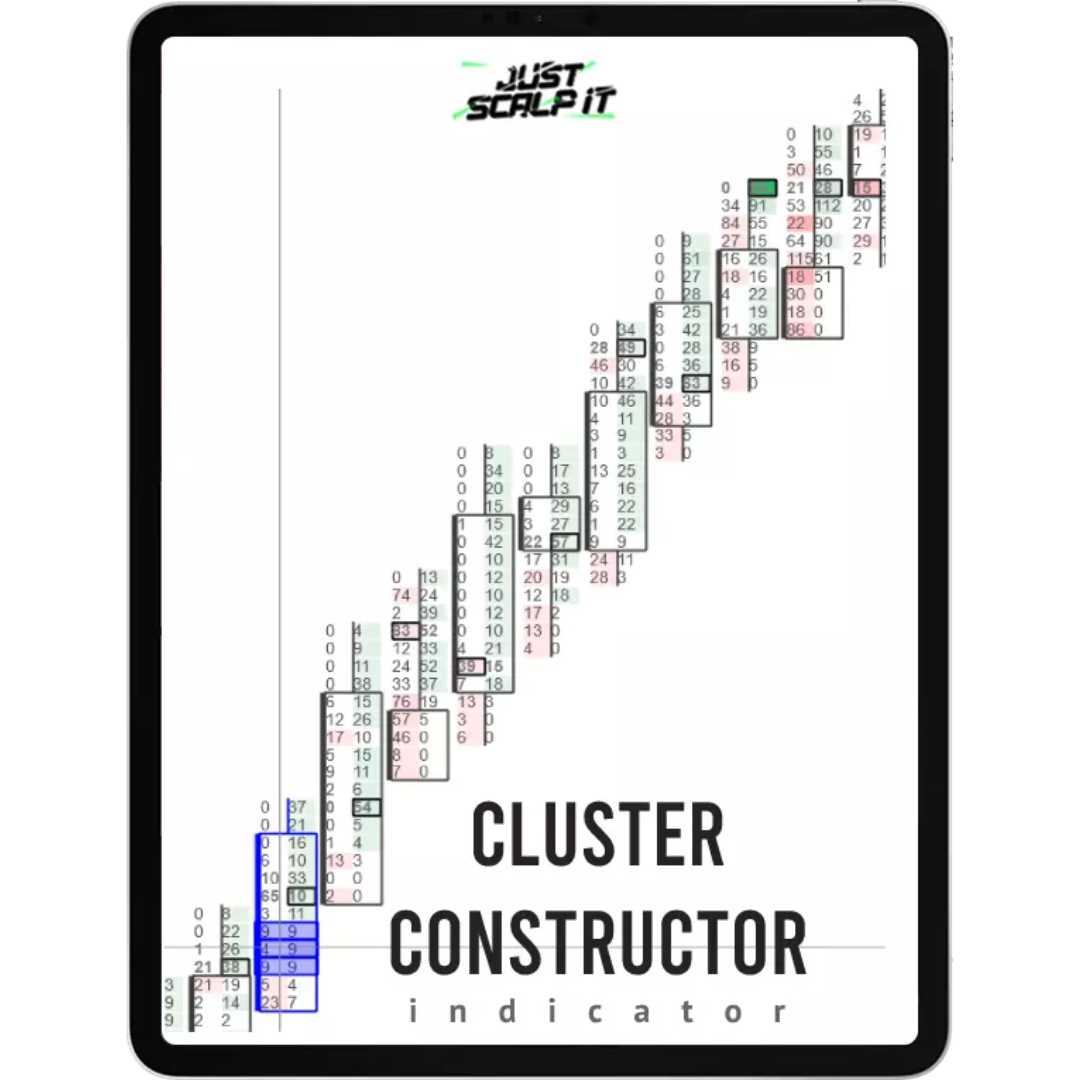
Explore the advanced order flow indicator, Cluster Constructor, featuring 16+ filters for deep market analysis (footprint charts). Ideal for unveiling smart money and institutional trends, enhancing order flow trading strategies. Delve into sophisticated insights – start now!
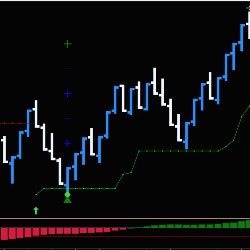
The ATS_TrendRider indicator toolset plots trend reversals and trend extensions. Fully customizable for your trading preference, each identified trade plots the entry, stop loss, and profit targets based upon current ATR.
Custom strategy design in BloodHound. Remek! will program your trading strategy as per your specifications and requirements. Learn more!
The VWAP Predator uses VWAP as a zonal guide with Bull and Bear Bands. It then uses logic to recognize accumulation and distribution candles. If those candles cross from a zone to another, then a Signal Candle is produced. Buy Signals in the Bullish Bands and Sell Signals only in the Bearish Bands.
Our SuperTrend Indicator will catch the trend and improve trading consistency with smart trend-following trading signals. SuperTrend highlights trend direction, continuation and reversals while filtering out false signals. Buy & sell signals are printed onto the chart when trend direction changes.
December 2, 2024
Mastering Sideways Markets With Auction Bars and Range Projections
November 19, 2024
Enhancing Your Automated Trading System: Key Insights from Best Pro Trade
November 14, 2024
NinjaTrader New Ecosystem Tools: October 2024 Edition
Enter Email for Updates