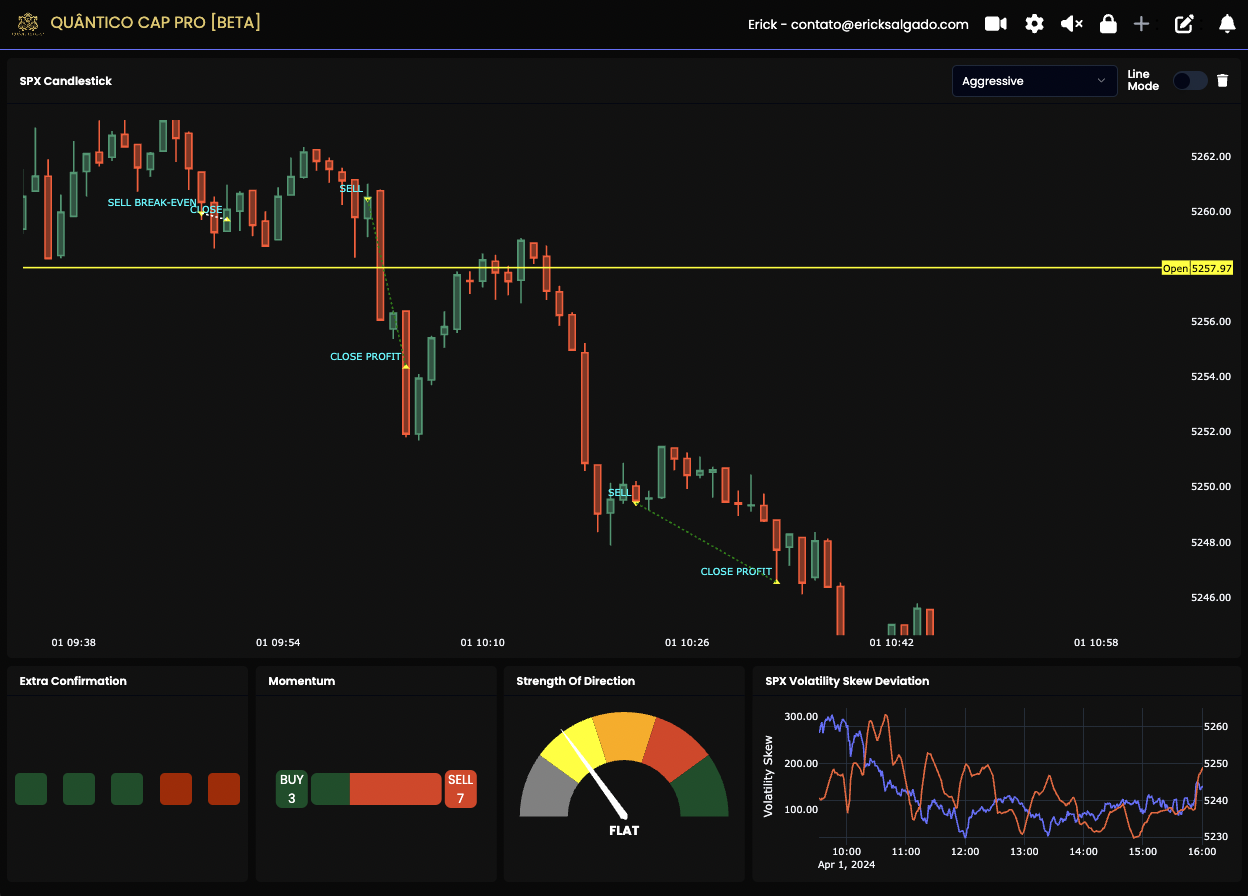
Access clear buy and sell signals tailored for trading precisely when our algorithm detects market maker interventions. Exclusively offered for ES and NQ, seize the opportunity to join our community of hundreds of traders already leveraging 0DTE and Market Maker setups.
This tool uses price action, trend and momentum to identify price zones (TrapZones) and price bars (TrapBars) where traders can get trapped in the market. Trade good setups while avoiding bad trades e.g. FOMO, catching a falling knife, or fighting the trend, using automated technical analysis!
The Viper Indicators include long and short trade entry signals as well as a trend indicator which can be used as a trade re-entry trigger and trailing stop. After many years of development and rigorous testing in a live trading environment, this system has proved itself with traders all around the world.
ChartIdentifier renders instrument information directly on the chart to assist with easy chart identification. Choose what instrument format you want to display and optionally add a prefix value.
This is a fully automated trading robot that is consistent year over year. It automatically sets position sizing and trailing targets based on market volatility & automatically sends an email when it enters a trade. You can customize present variables that can be changed based on individual needs.
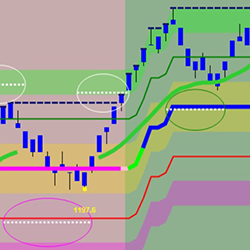
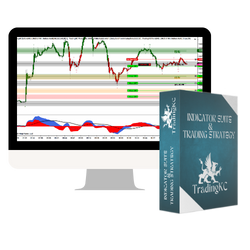
Simplify your trading with my strategy: trend, price action, support/resistance and momentum. Green/red bars indicate trend, custom ExCon indicator manages setups, pivots show support/resistance and MACD ties it all together. Clear entries, take profits and exits with simple rules for engagement.
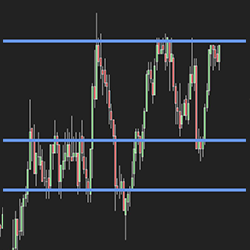
Support/Resistance Levels can be tedious to look for. You have to go back on your chart (with a changing Y axis), and it can be hard to spot every significant point of contact. Tyche Trading’s Automatic S/R Indicator eliminates that with a high level of precision. Get a seven-day free trial today!
We provide an all-in-one fully-featured automated trading strategy ready to trade any market (Futures, Stocks, Forex). We deliver the utmost reliability and frequently release new features free of charge. Schedule your FREE demo today and see how our members have boosted their trading performances.
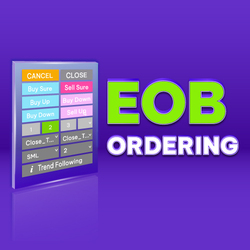
EOB or End Of Bar is an amazing close-bar order tool that is nowhere else to be found. This amazing add-on works with any bar types. Let EOB Ordering play the tough game for you, as it was designed to reduce the ordering time to just a few milliseconds.
Trade your own capital with consistency. Follow your own plan from day one. Develop and demonstrate your trading skills. Pass qualification to get a Master Account. Show results and get your first $10k withdrawal commission-free. Invest in yourself. It's time to catch a wave!
December 2, 2024
Mastering Sideways Markets With Auction Bars and Range Projections
November 19, 2024
Enhancing Your Automated Trading System: Key Insights from Best Pro Trade
November 14, 2024
NinjaTrader New Ecosystem Tools: October 2024 Edition
Enter Email for Updates