Free Room includes sessions to learn trading tips, watch live markets, and news releases. There are evening and early morning special sessions to prepare for the day, and week ahead. See live market setups and learn how to manage risk and trades.
KaseX is a symbol based technical analysis trading study with a simple, uncluttered display. KaseX captures dozens of complex technical signals in multiple time-frames. Variable optimization is unnecessary as pre-configured sensitivity settings are built in. Take a free 30-day trial today!
A precise analytical tool derived from statistical trading metrics such as prices and volume, offering insights to inform trading decisions.
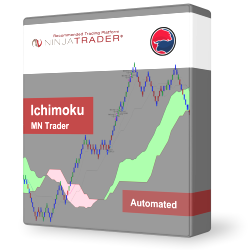
Ichimoku MNTrader is a fully automated trading system. Trading is based on the Ichimoku Kinko Hyo indicator, patterns and zigzag to filter out false signals and build more accurate analysis. It uses Renko charts and is suitable for all futures and Forex trading instruments.
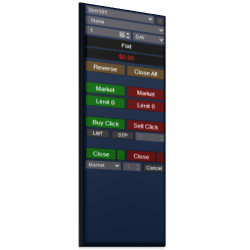
The Close Bar Entry Orders module initiates logic to submit orders immediately on the close of a bar. All orders are submitted using the account, quantity, and ATM strategy controls in the Enhanced Chart Trader. This removes unnecessary stress and challenge from entering orders when a bar closes.
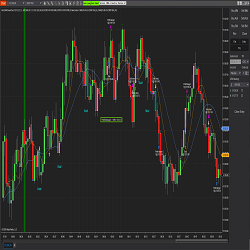
The SMA CrossOver Strategy is one of the simplest, for ease of use and understanding. This simple strategy has been amped-up to include current day price Highs and Lows, Traps, Consolidation, Long Bar and dynamic Bullish and Bearish trend algorithms for precision filtering to find the perfect entry.
Visit our website, leave your e-mail address and get our document for free!
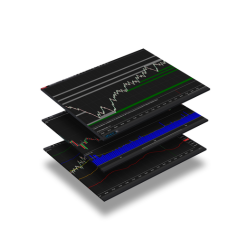
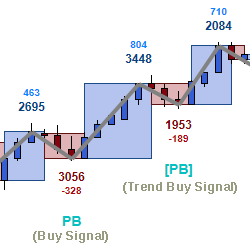
MBoxWave Wyckoff Trading System is an order flow trading system using bid/offer and momentum to identify supply/demand imbalances. The system contains a series of indicators and signals designed to be used together to identify high probability trading opportunities, inspired by Wyckoff methodology.
This product is a automated bot strategy that work on NQ and MNQ only.
Every download will receive a 14-day Free Trial of the app on either Android or Iphone. You will be able to test the technology, analysis, trading signals and everything else at no cost. See how Forex Trading Unlocked can enhance your forex and futures trading. Gain trading consistency!
December 2, 2024
Mastering Sideways Markets With Auction Bars and Range Projections
November 19, 2024
Enhancing Your Automated Trading System: Key Insights from Best Pro Trade
November 14, 2024
NinjaTrader New Ecosystem Tools: October 2024 Edition
Enter Email for Updates