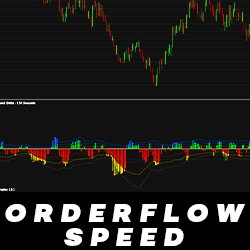
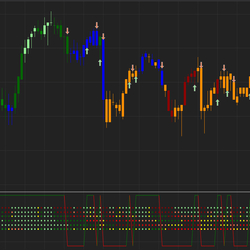
Deceptively simple, Orderflow Speed allows you to monitor market speed and enables you to view trading activity directly from your chart. It supports the Tick Replay feature so that you can visualize historical trading activity.
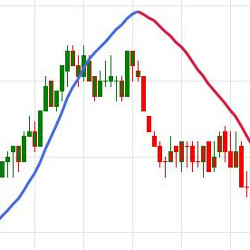
The TrendLord indicator is a chart overlay indicator that can be used as a confirmation indicator. It is a derivative of a smoothed moving average but with the advantage of representing it as a colored change histogram. Click to learn more.
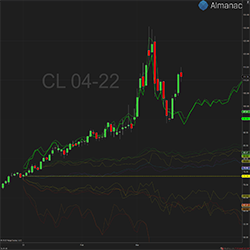
Accrue Inc. didn’t invent seasonality – they just made it easier to see and trade! Almanac™ Calendar Analytics creates better awareness of seasonality with 90-day price projections across five different market scenarios.
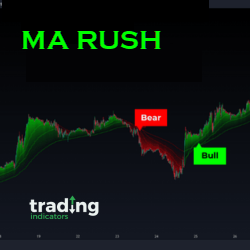
MA Rush is a trend-following indicator that provides intelligent multi-time frame analysis, adapting to different trading time frames. It predicts potential strong market trends, either uptrends or downtrends.
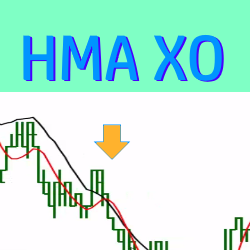
This trade setup indicator paints entry signals each time a Hull Moving Average (HMA) crossover occurs. The entry signals are customizable and can be filtered by the slope of the linear regression. Click here to watch a video and lean more!
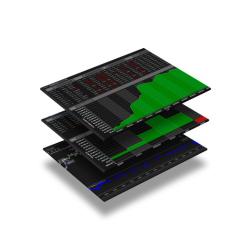
Get all of the most critical indicators in one package. Market Levels provides VWAP, Value Area High/Low, Point of Control, Initial Balance, Open, High, Low, Close and more helping you identify key price areas. Levels are plotted for the full session and a user customized session.
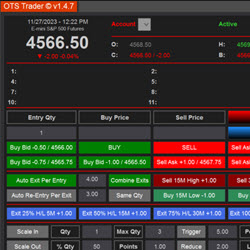
A category of automated tools designed for consistent rule-based trading management. Experience a structured approach to digital trading.
Uniquely streamlines your daily trading tasks, automating processes that would otherwise require manual effort. Organized into four key sections — first entry, second entries, auto stops and auto exits. Plus more.
Nordman Algorithms provides indicator and strategy programming services. Indicators for trend identification, trade zone detection, news impact calculation, price pattern visualization & more can be built, as well as extendable, maintainable systems that follow your trade strategy.
TC_TrendingTSF is a ‘smarter’ time series forecast line - a type of Linear Regression. By measuring the slope of the line, and the position of the line compared to price, this indicator can quite neatly reveal the current trend - even during sharp retracements. Free to download and use!
December 2, 2024
Mastering Sideways Markets With Auction Bars and Range Projections
November 19, 2024
Enhancing Your Automated Trading System: Key Insights from Best Pro Trade
November 14, 2024
NinjaTrader New Ecosystem Tools: October 2024 Edition
Enter Email for Updates