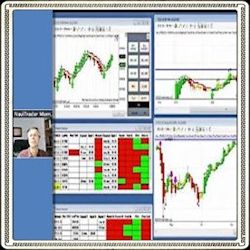
Would you like to improve your trading? Learn how to analyze the live market & the key factors that are critical for success! Open M-F, 9 – 11 AM ET, the Member Room provides the knowledge & demonstrates the tools needed to trade the ES, NQ, CL & more. Get started NOW with FREE live market training!
Enhance your trading with our point and click Anchored VWAP indicator for NinjaTrader 8. Built as an indicator, not a drawing tool. Features unique point-and-click anchor setting with hotkeys, 3 customizable deviation bands, and 8 VWAP calculation methods. Start your free trial today!
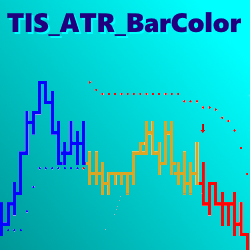
The ATR_BarColor Setup is the evolution of Supertrend; it adds a 3rd state ( Trending Up, Trending Down and Non-Trending ) that helps to avoid sideways market conditions. Bars are colored for quick condition identification.
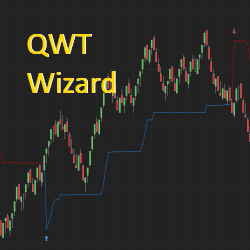
This indicator uses the simple idea of momentum reversal and identifies an entry or exit position. It also shows if the market is sideways or trending. Wizard was named after a trader who was nicknamed “The Wizard” for the use he got out of this algo.
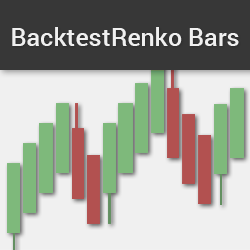
The hybrid Renko bar is two bar types in one. With adjustable backtesting capability, it utilizes true trade data for the Open, High, Low, & Close of each bar. Price gaps are accurately portrayed on the chart. Eliminate chart noise with one of the most precise Renko on the market. Get it now!
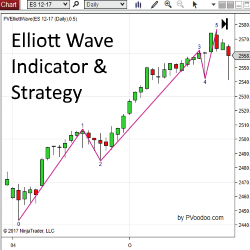
PVElliottWave Indicator is an Elliott Wave indicator designed for the NinjaTrader platform. Get started with a free trial of this indicator now!
The BuySide Global Auto Trader is a state of the art automated trading system monitoring software recognition of Institutional Buy and Sell programs. The system is universal and will work in any liquid market and many timeframes. Learn more!
Forex Trading Unlocked Online Trading Courses provide forex, futures, options, and binary options traders with the tools they need to navigate stormy market environments. Learn for yourself how to recognize trading setups that put you in the driver's seat of your trading destiny.
The Atlas Line begins plotting soon after the market opens. As it grows throughout the day, you will see entry signals (long and short) as well as supplemental "strength" and "pullback" signals. Many traders use the Atlas Line for its powerful signals and a big picture of anticipated price action.
By marking the high and low range from 8-9 AM and extending these levels along with the midpoint throughout the session, this indicator provides insights into market dynamics right after the open. Traders can use this information to strategize around the rejection or acceptance of these levels.
December 2, 2024
Mastering Sideways Markets With Auction Bars and Range Projections
November 19, 2024
Enhancing Your Automated Trading System: Key Insights from Best Pro Trade
November 14, 2024
NinjaTrader New Ecosystem Tools: October 2024 Edition
Enter Email for Updates