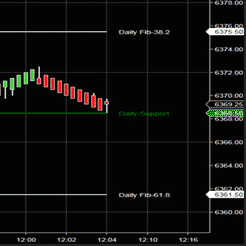
Trading123 Automatic Fibonacci Pivots draws the Fibonacci levels for you. No more second guessing as to where the price action is going. The Fibonacci levels move with the price action from one level to the next. Precise trading using price action for entries and exits at Fibonacci levels.
Unlock the power of fully automated NQ and MNQ futures trading with Steady Turtle. This advanced trend-following strategy adapts to market momentum and volatility, offering precise, emotion-free execution with robust risk management.
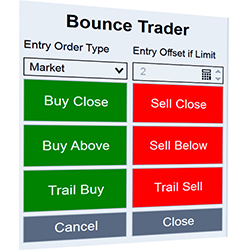
Get fast and accurate fills with Bounce Trader. Trade directly from your charts. Easily trigger orders on bar close, bar reverse or open OCO orders depending on how bar closes. Select between market or limit orders. With Bounce Trader and Simple EMA’s, it is easy to spot where price bounces from.
Our Partner Programmer service is ideal for traders with great ideas and a limited budget. We help code your ideas and instead of paying for the programming service, we enter a joint investment agreement.
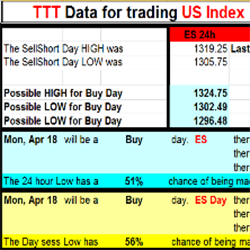
Based on the trading techniques of George Taylor, the TTT E-Book provides the necessary data to trade using the Taylor Trading Technique. After the market close receive 24 hour and daily data to plan your trades for the next trading session. Free 1-week trial available!
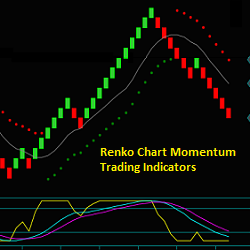
The Renko chart trading method and trading indicator training include Renko chart momentum reverse trades that begin a new swing, trading pullbacks with momentum resumption and flow for price continuation, and trading swing reverses with price and momentum extremes or divergences.
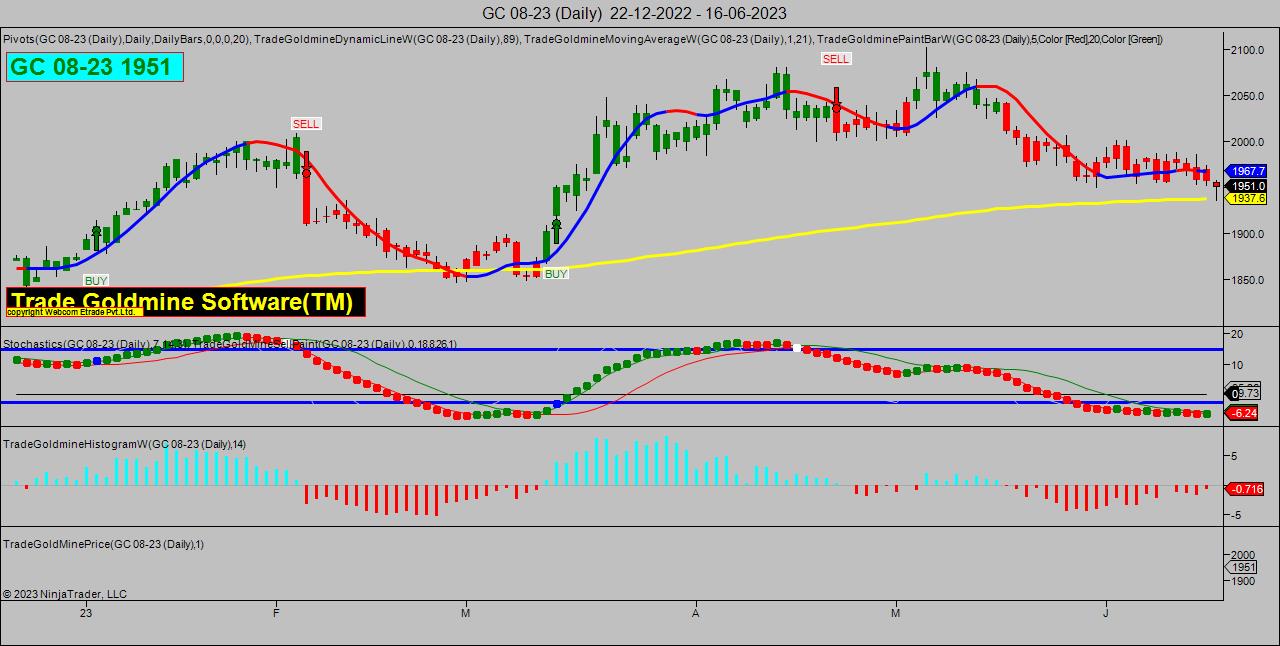
GOLDMINE NINJA TECHNIQUE software is a technical analysis tool that gives user-friendly BUY-SELL signals to traders and helps find perfect resistance & support levels in order to trade more effectively.
The Spread Trading Tool add on for NinjaTrader 8 allows for charting a variety of spread combinations from 2 leg 1:1 ratio spreads to more advanced butterfly spreads. A control panel connected to the strategy allows for easy entry and management of spread trades.
Using Renko/range/tick/volume bars? Optimal Speed analyses the length of time a bar took to form in order to highlight possible congestion areas. Instantly see the slowest bar of the session, slower-than-average bars, crawl bars and the slowest up and down bars of the day. Strategy compatible.
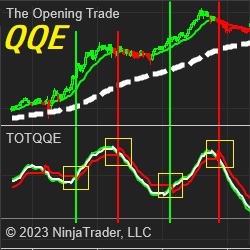
This is the indicator used in the QQE Swing system. This indicator is a version of the popular RSI that, in theory, uses moving averages to smooth the RSI and price. Like any other indicator, this should be paired with additional indicators. It is coded to be used with the strategy builder.
December 2, 2024
Mastering Sideways Markets With Auction Bars and Range Projections
November 19, 2024
Enhancing Your Automated Trading System: Key Insights from Best Pro Trade
November 14, 2024
NinjaTrader New Ecosystem Tools: October 2024 Edition
Enter Email for Updates